FairValueGap

4.5
03/09/2025
701
Desktop
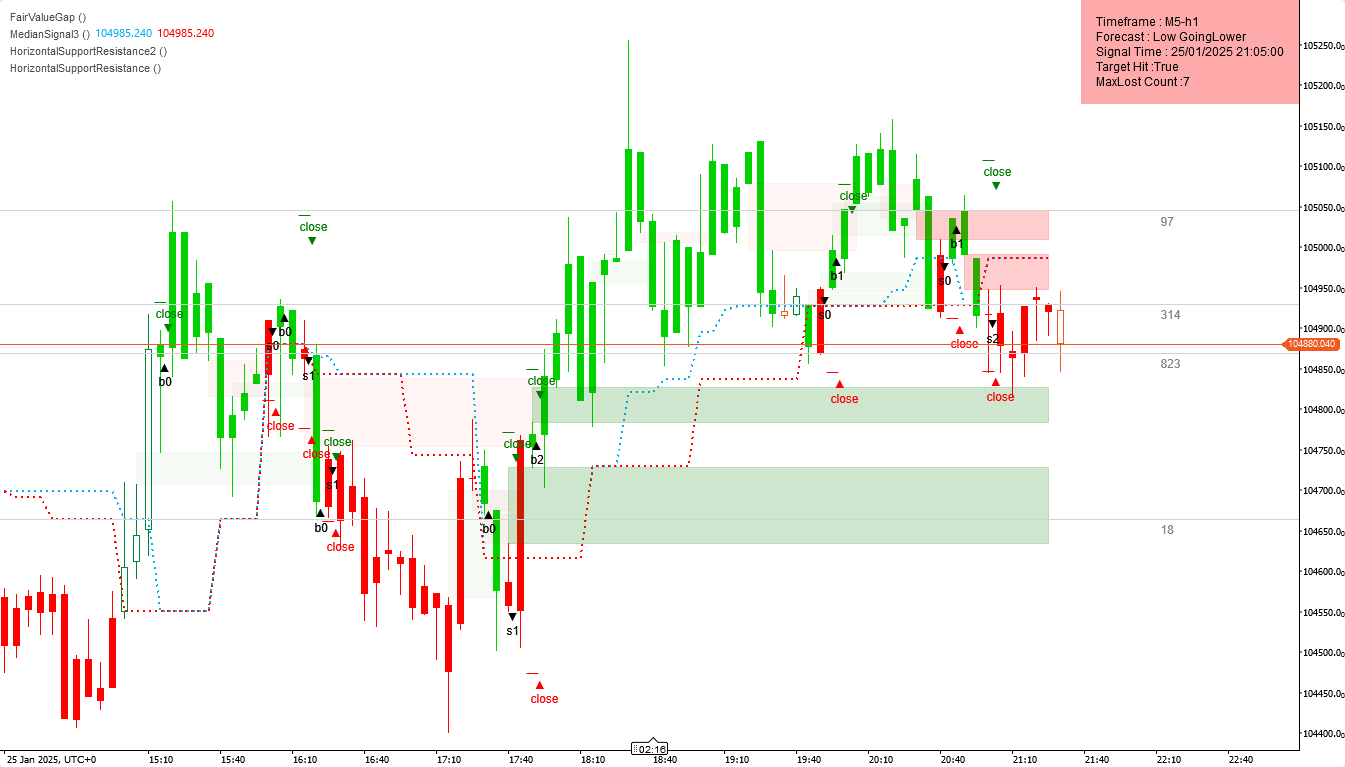
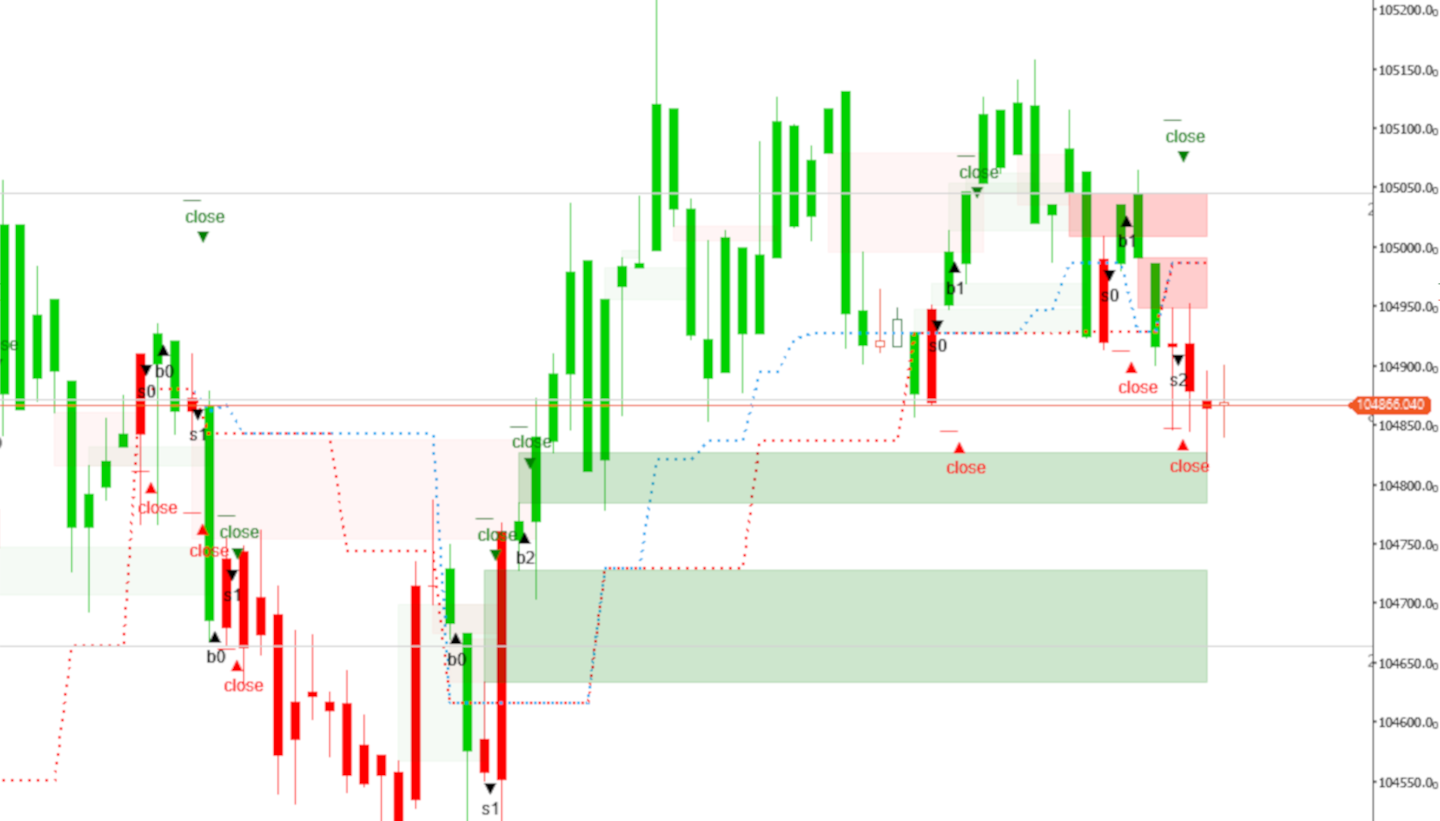
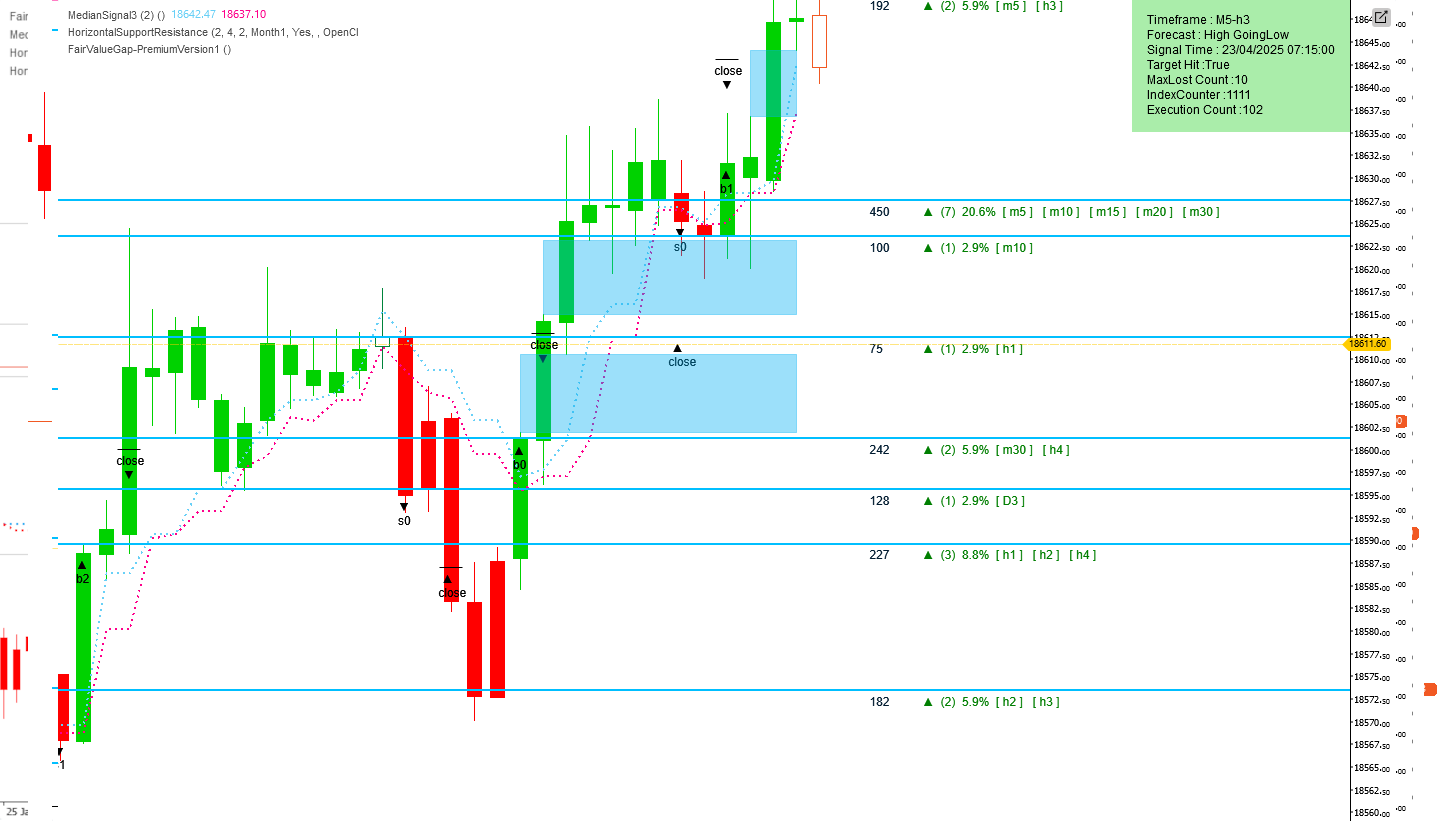
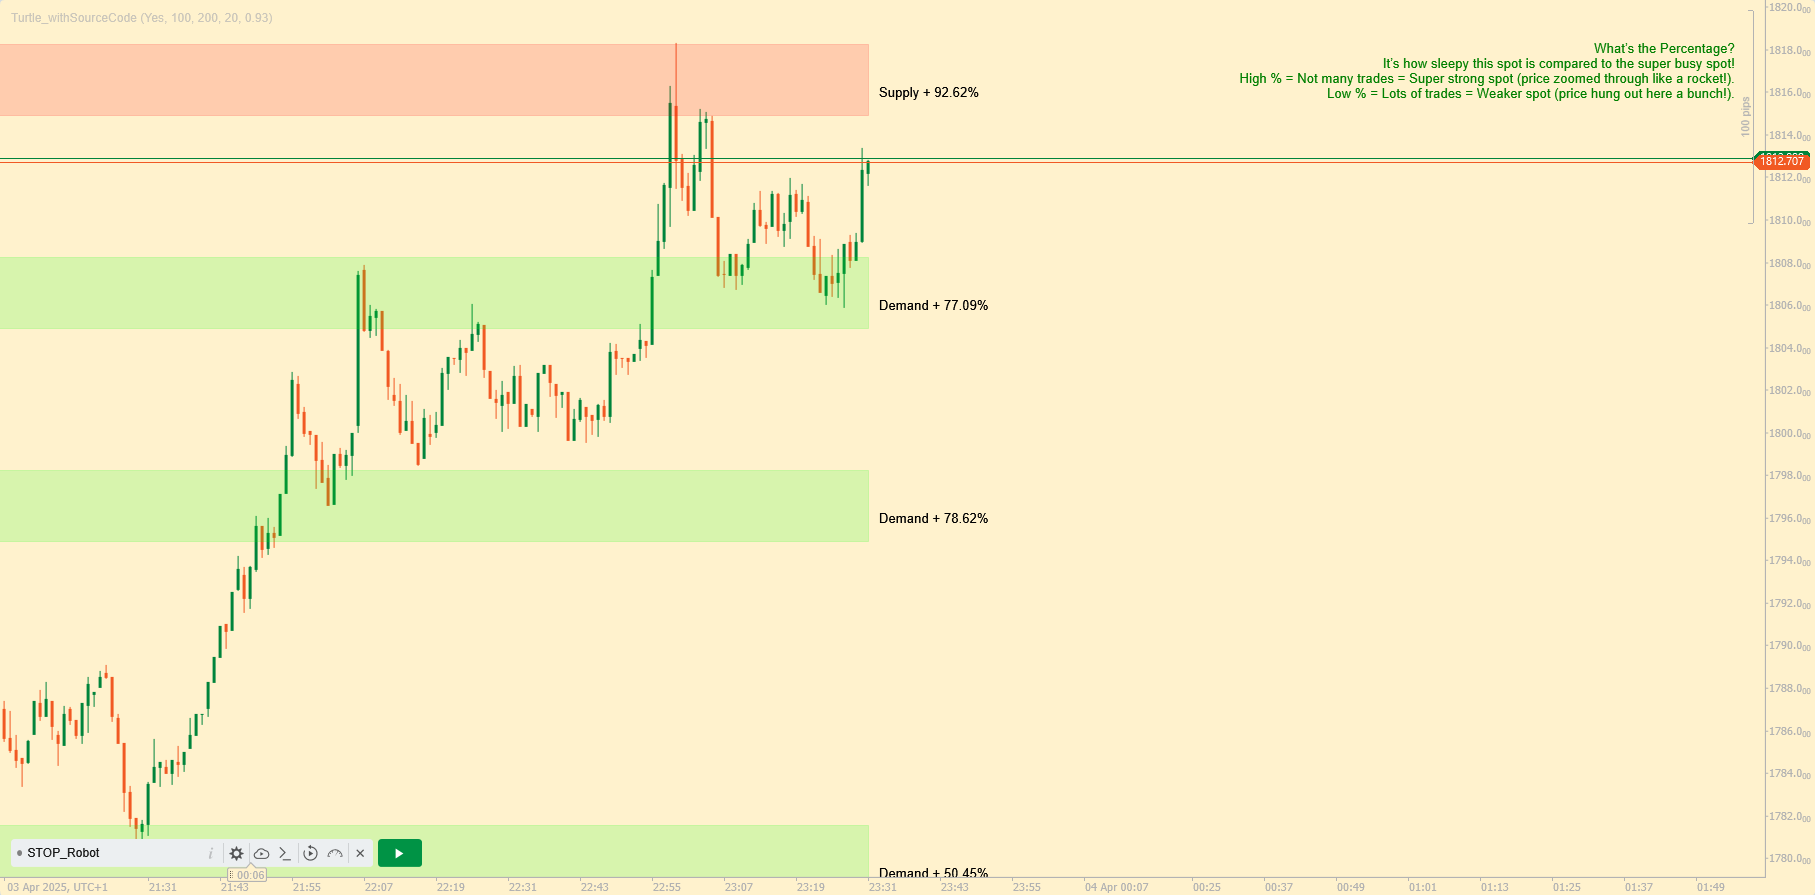
The Fair Value Gap (FVG) indicator is a technical analysis tool designed to pinpoint potential price imbalances in the market. These gaps occur when the price moves rapidly, creating a zone with minimal trading activity—often referred to as a "void." Such imbalances may indicate a likelihood of price retracement, as the market tends to seek balance by revisiting these areas.
Settings Overview
- Bars To Load: Specifies the number of historical bars to analyze, starting from the most recently completed one and moving backward.
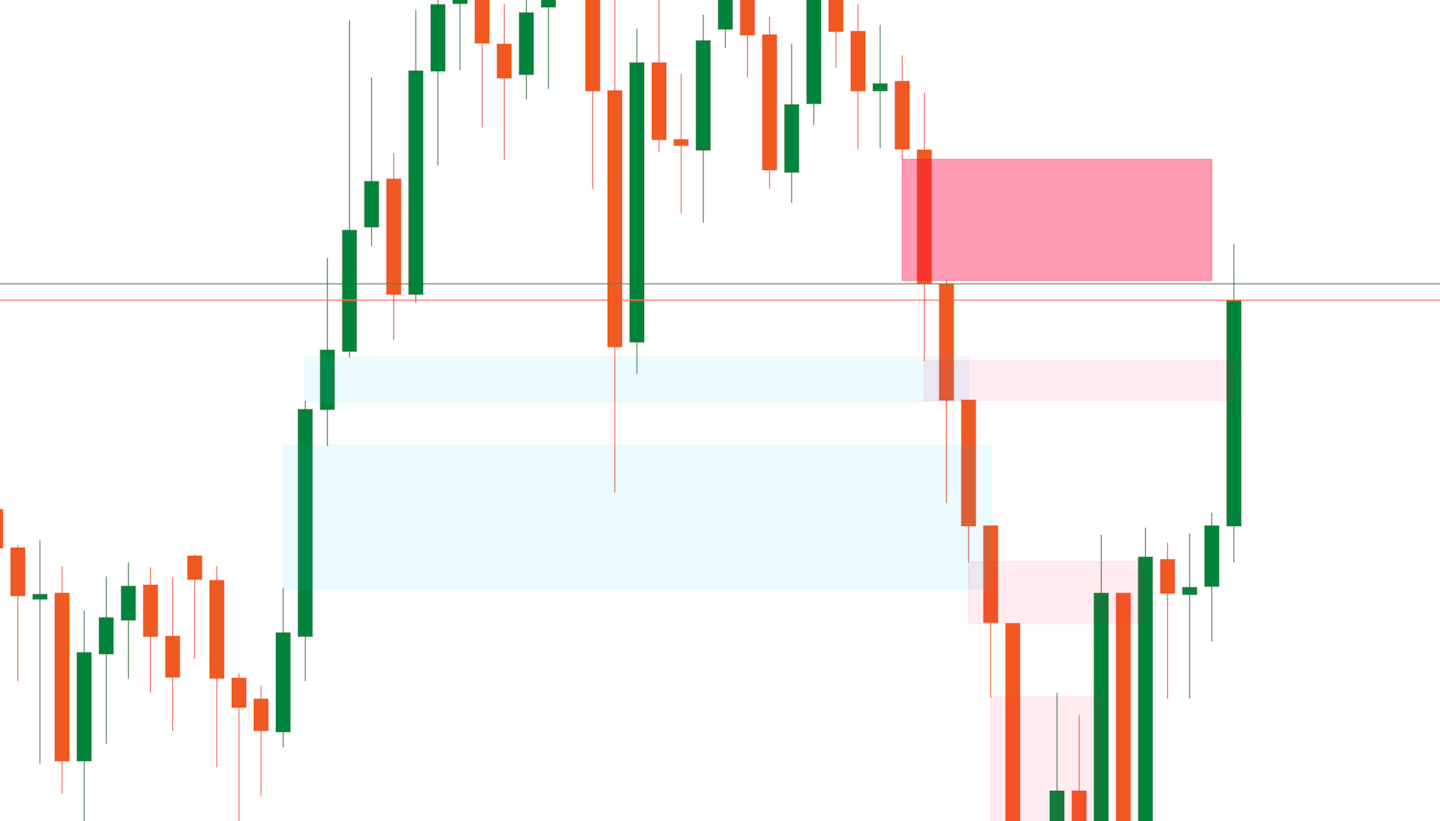
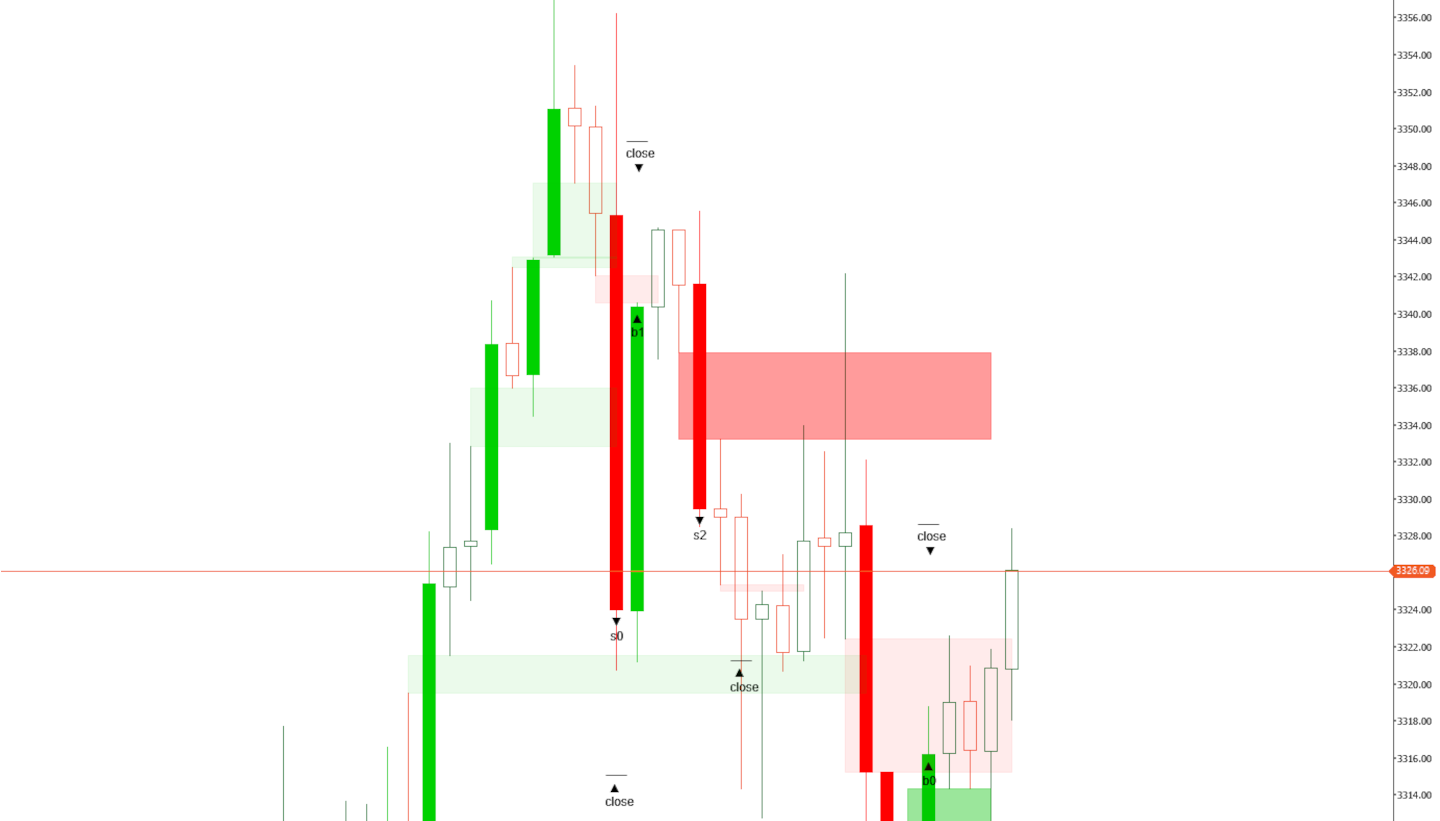
- Bullish FVG Color: Sets the color for FVGs that appear in an uptrend. A 30% transparency is applied so that elements behind the gap remain visible.
- Bearish FVG Color: Sets the color for FVGs that appear in a downtrend, also with 30% transparency for better chart visibility.
Premium Features (Available in the Paid Version)
- Delete Closed Gaps: A Boolean setting—when enabled ("yes"), it automatically removes all closed gaps; if disabled ("no"), the gaps remain visible. This is particularly useful on lower timeframes (under 20 minutes).
- Edit/Remove Gaps: Allows traders to adjust or delete gaps manually. This gives experienced traders greater control, especially since very small gaps typically offer little influence on price movement.
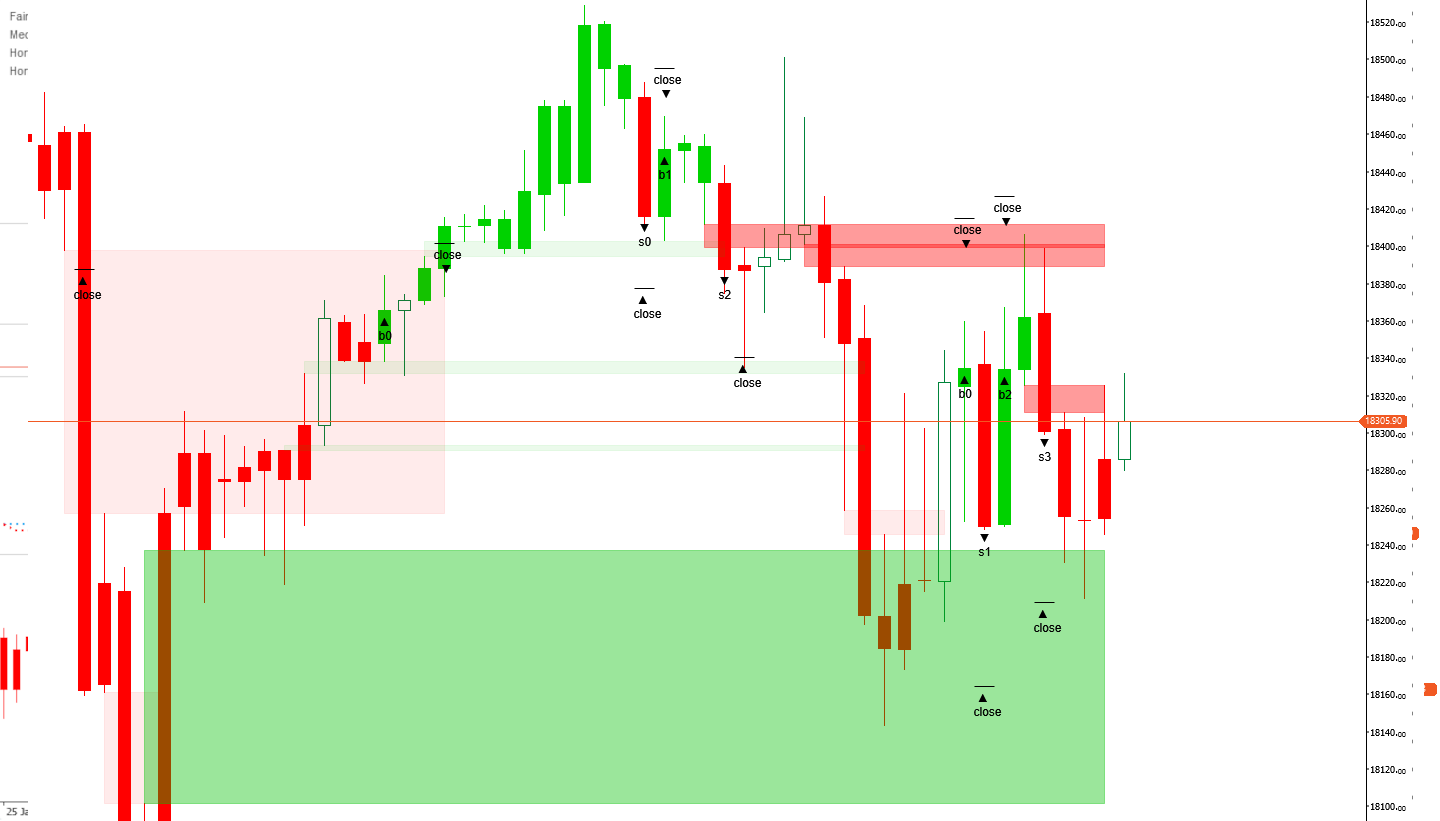
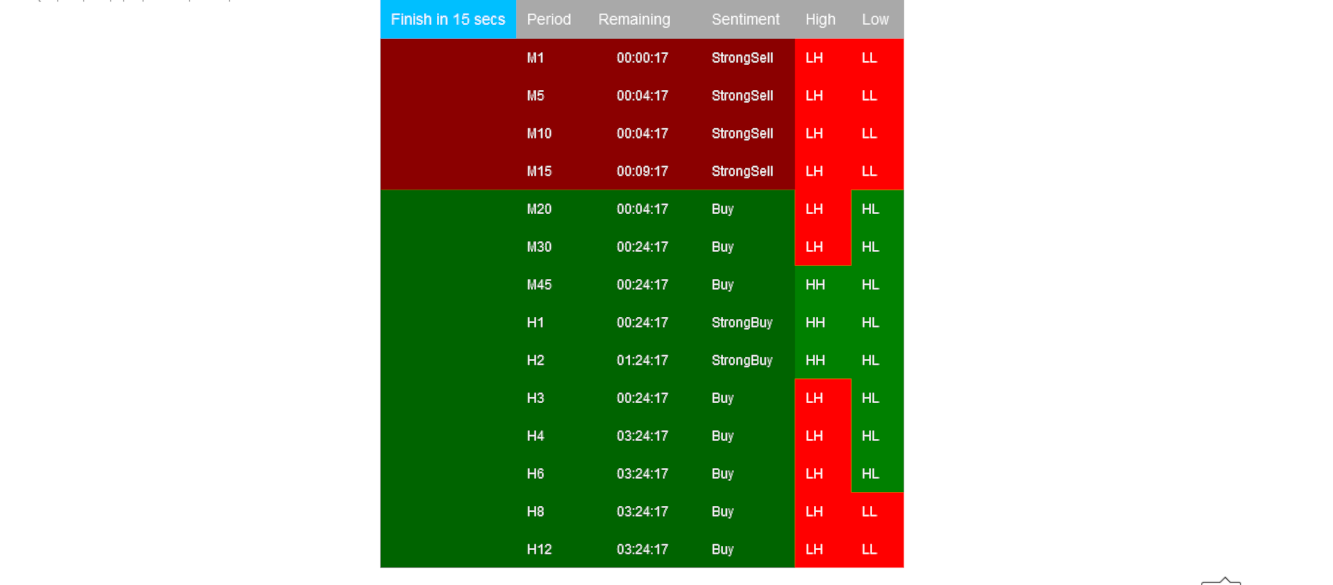
- Set Timeframe: Offers two options—use the current chart's timeframe or select a different one for analysis, while still displaying results on the main chart. This feature helps traders gain faster insights into probable market movements.
- Selected Timeframe: Specifies the desired timeframe for analysis if "Selected Timeframe" is chosen in the setting above.
- Small Gap Accuracy: Lets traders input a preferred gap size as an integer, helping them identify gaps that historically lead to favorable outcomes. The value is based on the entire dataset and gap sizes observed for the asset.
By default, the indicator scans all imbalances within a single timeframe. However, access to premium features through the FairValueGapPremium version can greatly enhance analytical capabilities.
More from this author

You may also like
!["[Stellar Strategies] Ultimate Trend & Momentum Dashboard" logo](https://market-prod-23f4d22-e289.s3.amazonaws.com/d8a894f3-34df-4f37-b4a3-c37e971e4e1f_cT_cs_4141285_NAS100_2025-06-24_17-12-20.png)
.png)
!["[Stellar Strategies] Inside Bar with Signals" logo](https://market-prod-23f4d22-e289.s3.amazonaws.com/c12d088e-7b52-4961-a0d2-7e38a2499bd3_cT_cs_4141285_EURUSD_2025-07-15_13-15-32.png)

 Small.jpeg)
!["[Hamster-Coder] Pivot Points MTF" logo](https://market-prod-23f4d22-e289.s3.amazonaws.com/08b4bf19-ebf2-422e-9a8a-b4a97bc636ca_Icon300.jpg)