
Fibonacci Indicators
Explore Fibonacci indicators and chart tools that speed up retracement and extension mapping on the chart. Compare auto-drawing variants, multi-timeframe options, and alert-enabled indicators that support pullback-based trading strategy setups. Useful for planning entries, targets, and stop placement with consistent rules across FX, gold, and indices.
Alat
Perbandingan alat
Soalan Lazim



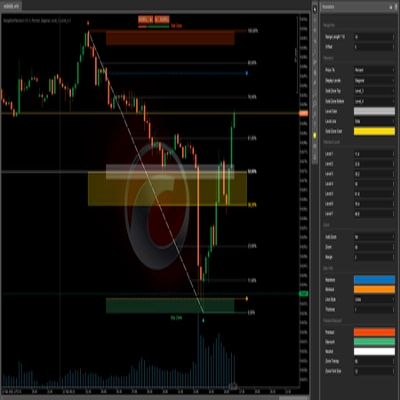
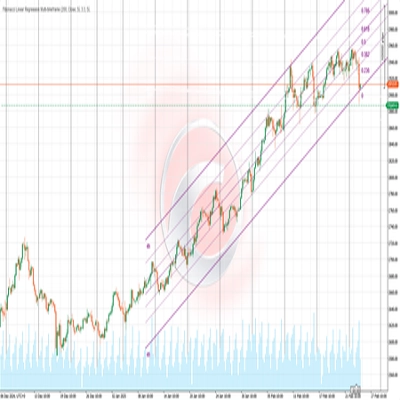


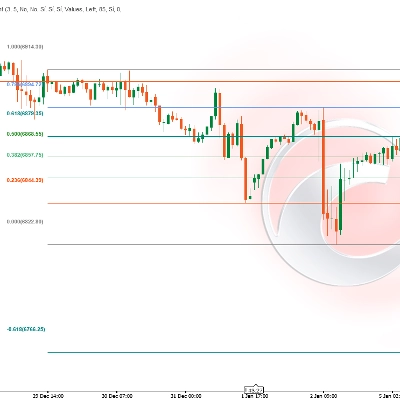





Perbandingan alat
Produk | Ulasan | Muat turun | Jualan | Harga | Platform yang serasi |
|---|---|---|---|---|---|
VWAP (Volume Weighted Average Price) | 5.0 (1) | 1.85K | — | Percuma | Windows, Mac |
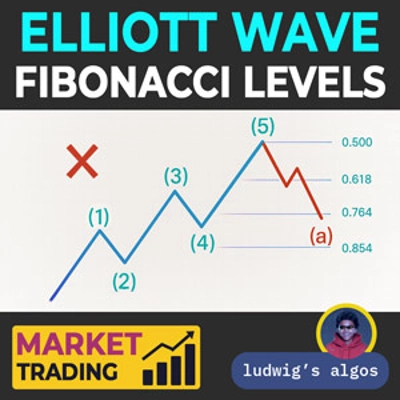
Elliott Wave Fib Auto | 5.0 (1) | — | 15 | $49 | Windows, Mac |
VGM - Auto Fibo Retracement | 3.3 (3) | 1.11K | — | Percuma | Windows, Mac |
VegaXLR - ZigZag Alerts | 4.5 (4) | — | 12 | $19 | Windows, Mac |
Pivot Points Clasic,FIBO,etc | — | 981 | — | Percuma | Windows, Mac |
VegaXLR - cTrader Multi-Timeframe Pivot Pro | 4.8 (5) | — | 12 | $20 | Windows, Mac |
Fair Value Gap (Extended) | 5.0 (1) | 952 | — | Percuma | Windows, Mac |
RangeBoxFibonacci | 4.3 (3) | — | 11 | $29 | Windows, Mac |
Fibonacci Linear Regression Multi-timeframe | 5.0 (1) | 813 | — | Percuma | Windows, Mac |
VegaXLR - Auto Support and Resistance | 4.3 (3) | — | 9 | $20 | Windows, Mac |
Custom Timeframes | 5.0 (1) | 520 | — | Percuma | Windows, Mac |
SmartFibonacci | 4.3 (4) | — | 7 | $19 | Windows, Mac |
Auto Fib Retracement | — | 494 | — | Percuma | Windows, Mac |
Complete ICT SMC Suite - ADR AWR AMR OHLC Fibs EIS SR Alert | 4.3 (3) | — | 7 | $49 | Windows, Mac |
AutoFibRetracement | — | 490 | — | Percuma | Windows, Mac |
Fair Value Gaps_FVG_MTF | 4.7 (3) | — | 6 | $25 | Windows, Mac |
Price Projection Swing Volume | — | 414 | — | Percuma | Windows, Mac |
Auto Tools Suite | 4.3 (3) | — | 6 | $19 | Windows, Mac |
Fibonacci Prediction Channel | — | 347 | — | Percuma | Windows, Mac |
LT_Ind_Candles | 4.0 (2) | — | 4 | $19 | Windows, Mac |
Initial Balance | 4.5 (2) | 337 | — | Percuma | Windows, Mac |
VegaXLR - cTrader Pitchfork & Channel Enhancer | 4.5 (2) | — | 4 | $19 | Windows, Mac |
FIBONACCI Volume Delta Indicator | — | 324 | — | Percuma | Windows, Mac |
CHOCH BREAKOUT BLOCK | 4.7 (6) | — | 4 | $19 | Windows, Mac |
Daily Fibo | 4.5 (2) | 273 | — | Percuma | Windows, Mac |
VegaXLR - Fibonacci Alerts | 4.5 (4) | — | 3 | $19 | Windows, Mac |
TrendFibonacci | — | 272 | — | Percuma | Windows, Mac |
Automatic Fibonatti | 4.6 (5) | — | 3 | $25 | Windows, Mac |
PrevDayProjection | — | 267 | — | Percuma | Windows, Mac |
Gann-Fib Session Matrix | 4.5 (2) | — | 2 | $40 | Windows, Mac |
Drawing Utility | — | 243 | — | Percuma | Windows, Mac |
Auto Fibonacci With Golden Levels | 4.7 (3) | — | 2 | $19 | Windows, Mac |
Fibonacci Pitchfan | — | 237 | — | Percuma | Windows, Mac |
VegaXLR - Analysis Tools Alerts | 4.5 (2) | — | 2 | $20 | Windows, Mac |
Advanced Regression Channel | — | 182 | — | Percuma | Windows, Mac |
VegaXLR - Fibonacci Bands | 4.5 (4) | — | 2 | $20 | Windows, Mac |
Fibonacci Automated Level | 4.0 (3) | — | 1 | $55 | Windows, Mac |
Auto Fibonacci Retracement | 4.3 (4) | — | 1 | $19 | Windows, Mac |
Fibonacci Channel | 4.6 (5) | — | — | dari $9 | Windows, Mac |
Analisis Fibo Mejorado | — | — | — | $120 | Windows, Mac |
AutoFib Navigator | 4.5 (2) | — | — | $30 | Windows, Mac |
Soalan Lazim
Fibonacci retracement levels divide a chosen swing into ratios derived from the Fibonacci sequence, plus the halfway mark, to show how far a pullback has travelled. Traders watch them as possible support or resistance; an auto-drawing indicator picks the swing itself instead of you anchoring the tool by hand.
Retracements measure a pullback inside a completed swing, while extensions or expansions project levels beyond it from a later point, often used as potential targets. cTrader's expansion tool works from two legs, so its levels depend heavily on which highs and lows you or an indicator pick as anchors.
Many anchor them to a clear swing on the timeframe they trade, from a major daily swing on EURUSD to an intraday leg on NAS100 or XAUUSD. Index and gold swings can be wide and gap after weekends or breaks, so some traders look for levels from several timeframes that cluster at one price.
Yes, an auto-drawing tool usually redraws when a new high or low replaces its anchor, so levels you saw earlier may no longer be on the chart. Price also ignores levels regularly, and with several ratios on screen one of them tends to look right afterwards, which flatters any review of history.
It cannot. The indicator draws levels and may alert you when price reaches one, but any pending order or stop at that price is yours to place and a level can fail at any time. Before relying on one, check past swings with the indicator loaded in cTrader Windows or Mac to see how price treated its levels.