
Descripción
Transforma el caos de precios en canales de tendencia claros con matemáticas de regresión precisas.
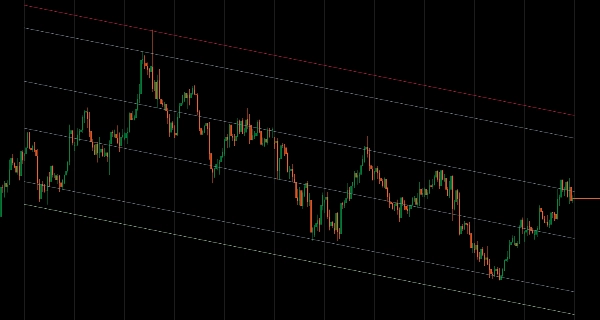
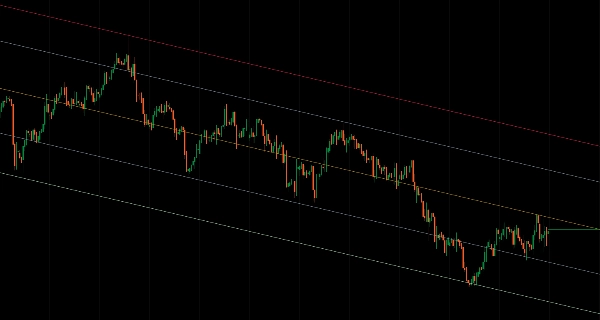
Regression Channel calcula una línea de regresión lineal a través de tus datos de precios seleccionados y dibuja límites superior/inferior basados en desviaciones de precio, ofreciéndote una visión estadísticamente fundamentada de la dirección de la tendencia y zonas potenciales de reversión.
Perfecto para
- Operadores de estructura que buscan una definición objetiva de la tendencia
- Operadores de reversión a la media identificando extremos de sobrecompra/sobreventa
- Operadores de ruptura que detectan violaciones de canal y cambios de momentum
- Análisis multitemporal: traza regresiones mensuales en gráficos diarios para contexto
Características clave
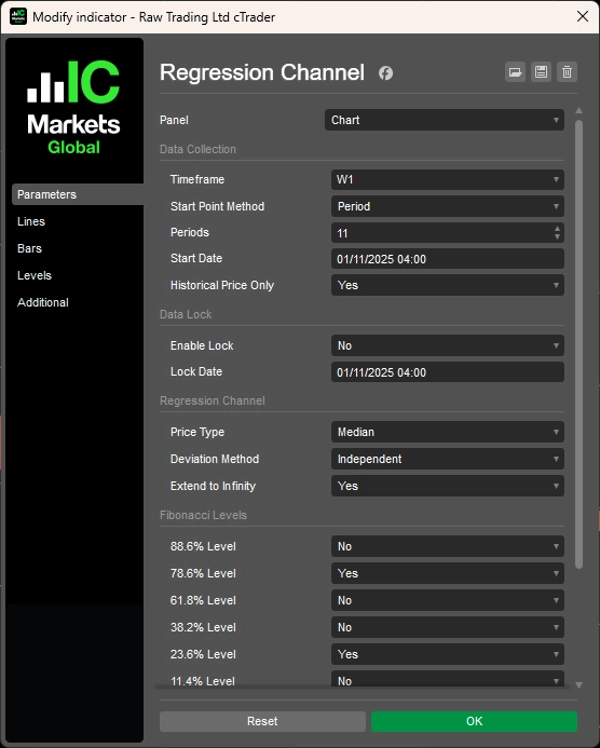
- Selección flexible de datos
-
- Modo período: analiza las últimas N barras (por ejemplo, las últimas 12 velas mensuales)
- Modo fecha y hora: comienza desde eventos o fechas específicas del mercado
- Mecanismo de bloqueo: congela el análisis en un punto histórico mientras el precio continúa
- Multitemporal: dibuja regresiones desde cualquier marco temporal en tu gráfico actual
- Métodos inteligentes de desviación
-
- Promedio: niveles equilibrados usando desviaciones medias (ideal para zonas de trading)
- Independiente: canales asimétricos que se adaptan a la volatilidad direccional
- Máximo: muestra límites extremos de precio para análisis de rango completo
- Herramientas profesionales
-
- 6 niveles de retroceso de Fibonacci (11.4%, 23.6%, 38.2%, 61.8%, 78.6%, 88.6%)
- 6 tipos de precio: Apertura, Máximo, Mínimo, Cierre, Mediana, Típico
- Modo solo histórico: excluye barras en formación para pruebas estables
- Opción de extender al infinito para proyecciones a largo plazo
- Personalización completa de colores
Por qué destaca
A diferencia de las herramientas básicas de regresión, este indicador te da control. Bloquea tu análisis para estudiar cómo se comportó el precio tras un evento específico. Cambia entre canales simétricos y asimétricos. Combina la estructura de marcos temporales superiores con la ejecución en marcos inferiores, todo con un código limpio y eficiente diseñado para la fiabilidad.
Gráficos limpios. Estructura clara. Decisiones confiadas.


![Logotipo de "[Hamster-Coder] Price"](https://cdn.ctrader.com/image/webp/893fb641-d5b3-44d8-91fb-6a2dc6f3d309_30647)


