
Descripción
Reversión de 3 barras
📊 ¿QUÉ ES?
El 3-Bar Reversal es un indicador técnico que identifica patrones específicos de reversión formados por exactamente tres velas consecutivas. Este patrón clásico señala posibles cambios en la dirección del precio mediante una estructura visual clara: una vela de tendencia, una vela de agotamiento y una vela de reversión.
🎯 ¿PARA QUÉ SIRVE?
Este indicador ayuda a los traders a:
- Detectar reversiones alcistas y bajistas con estructura de 3 velas
- Filtrar señales falsas mediante confirmación de tendencia configurable
- Identificar zonas de soporte y resistencia basadas en patrones confirmados
- Visualizar oportunidades de trading con marcadores intuitivos en el gráfico
- Operar reversiones de alta probabilidad en cualquier marco temporal
🔍 ¿CÓMO FUNCIONA?
Patrón Alcista (Reversión Alcista de 3 Barras)
Estructura de tres velas:
- Vela 1 (Bajista): Cierre por debajo de la apertura - confirma presión de venta
- Vela 2 (Agotamiento bajista): Hace nuevos mínimos Y nuevos máximos por debajo de la vela 1, con cierre bajista - señal de capitulación ⚠️
- Vela 3 (Reversión alcista): Cierre por encima de la apertura Y máximo por encima del máximo de la vela 1 - confirma cambio de control ✅
Patrón Bajista (Reversión Bajista de 3 Barras)
Estructura opuesta:
- Vela 1 (Alcista): Cierre por encima de la apertura - confirma presión de compra
- Vela 2 (Extensión alcista): Hace nuevos máximos Y nuevos mínimos por encima de la vela 1, con cierre alcista - señal de sobreextensión ⚠️
- Vela 3 (Reversión bajista): Cierre por debajo de la apertura Y mínimo por debajo del mínimo de la vela 1 - confirma cambio de control ✅
Sistema de Gestión Visual (Máquina de Estados)
El indicador procesa cada patrón en tres fases secuenciales:
FASE 1 - DETECCIÓN DEL PATRÓN: 🔍
- Se identifica la estructura completa de 3 velas
- Aparece un indicador de triángulo (▲ alcista / ▼ bajista) en la tercera vela
- Se dibuja un rectángulo semi-transparente de configuración que cubre:
-
- Alcista: Desde el máximo de la vela 1 hasta el mínimo más bajo (vela 2 o 3)
- Bajista: Desde el mínimo de la vela 1 hasta el máximo más alto (vela 2 o 3)
- Este rectángulo marca la "zona de batalla" donde ocurrió la reversión
FASE 2 - CONFIRMACIÓN O INVALIDACIÓN: ⏳
El sistema espera la siguiente vela después del patrón para validarlo:
Confirmación Alcista: ✅
- El cierre de la siguiente vela debe superar el máximo de la vela 1 (techo del rectángulo)
- Aparece un punto sólido (●) que marca la confirmación
- El rectángulo se convierte en una zona de soporte activa
Confirmación Bajista: ✅
- El cierre de la siguiente vela debe romper el mínimo de la vela 1 (suelo del rectángulo)
- Aparece un punto sólido (●) que marca la confirmación
- El rectángulo se convierte en una zona de resistencia activa
Invalidación: ❌
- Falla alcista si: cierre por debajo del mínimo del rectángulo O aparece patrón bajista
- Falla bajista si: cierre por encima del máximo del rectángulo O aparece patrón alcista
- El rectángulo deja de extenderse (el patrón muere)
Extensión en Espera: ⏸️
- Si no hay confirmación ni fallo, el rectángulo se extiende horizontalmente vela a vela
FASE 3 - ZONA ACTIVA DE SOPORTE/RESISTENCIA: 🎯
- Una vez confirmada, la zona se extiende indefinidamente hacia la derecha
- Zona alcista: Permanece activa mientras el precio se mantenga por encima del suelo
- Zona bajista: Permanece activa mientras el precio se mantenga por debajo del techo
- La zona se desactiva cuando el precio la rompe completamente en dirección opuesta
⚙️ CONFIGURACIÓN PRINCIPAL
Modo de Patrón
Controla qué variaciones de patrón son aceptadas:
- Normal: Solo acepta cuando la vela 3 cierra DENTRO del rango de la vela 1
-
- Alcista: Cierre < máximo de la vela 1 (reversión moderada)
- Bajista: Cierre > mínimo de la vela 1 (reversión moderada)
- Mejorado: Solo acepta cuando la vela 3 cierra FUERA del rango de la vela 1 🔥
-
- Alcista: Cierre > máximo de la vela 1 (reversión explosiva)
- Bajista: Cierre < mínimo de la vela 1 (reversión explosiva)
- Todos (Recomendado): Acepta ambos tipos sin distinción ⭐
Tipo de Soporte/Resistencia
- Nivel: Funcionalidad básica de línea (limitada en esta versión)
- Zona: Dibuja rectángulos sombreados marcando zonas SR tras confirmación 📦
- Ninguno: No muestra zonas SR, solo patrones detectados
Colores Personalizables 🎨
- Color de Reversión Alcista: Para triángulos, rectángulos y zonas alcistas (por defecto:
#2962FF- azul) - Color de Reversión Bajista: Para triángulos, rectángulos y zonas bajistas (por defecto:
#FF9800- naranja) - Color de Tendencia Alcista: Para visualización del filtro de tendencia (por defecto:
#089981- verde) - Color de Tendencia Bajista: Para visualización del filtro de tendencia (por defecto:
#F23645- rojo)
🔧 FILTROS DE TENDENCIA
El indicador puede filtrar patrones según la dirección general de la tendencia usando cuatro métodos:
1. Nube de Medias Móviles ☁️
Usa dos medias móviles para identificar la tendencia:
Parámetros:
- Tipo de Media Móvil: Simple, Exponencial, Hull, Ponderada, etc. (por defecto: Hull)
- Periodo Rápido: 50 (por defecto)
- Periodo Lento: 200 (por defecto)
Lógica del Filtro (Alineado):
- Tendencia alcista detectada cuando: Precio > MA Rápida Y MA Rápida > MA Lenta ✅
- Tendencia bajista detectada cuando: Precio < MA Rápida Y MA Rápida < MA Lenta ✅
- Solo muestra patrones alcistas en tendencia alcista y patrones bajistas en tendencia bajista
Lógica Opuesta (Opuesto):
- Invierte condiciones para capturar reversiones mayores contra la tendencia
2. Supertrend 📈
Indicador de seguimiento de tendencia basado en volatilidad (ATR):
Parámetros:
- Periodo ATR: 10 (por defecto) - ventana de cálculo de volatilidad
- Factor Multiplicador: 3.0 (por defecto) - sensibilidad del indicador
Lógica:
- Calcula bandas superior e inferior usando ATR
- Precio por encima de Supertrend = tendencia alcista 🟢
- Precio por debajo de Supertrend = tendencia bajista 🔴
- Filtra patrones según la alineación configurada
3. Canales Donchian 📊
Usa extremos de precio durante un período:
Parámetros:
- Longitud del Canal: 13 (por defecto)
Lógica:
- Canal superior = máximo más alto de N períodos
- Canal inferior = mínimo más bajo de N períodos
- Punto medio = (superior + inferior) / 2
- Precio por encima del punto medio = tendencia alcista 🟢
- Precio por debajo del punto medio = tendencia bajista 🔴
4. Ninguno (Sin Filtro) 🔓
Muestra TODOS los patrones de 3 barras detectados sin considerar la tendencia general. Útil para:
- Mercados en rango
- Análisis puro de patrones
- Trading de reversión en cualquier contexto
Alineación de Tendencia
Se aplica cuando el filtro está activo:
- Alineado: Solo muestra patrones que VAN CON la tendencia identificada ➡️
-
- Solo patrones alcistas en tendencia alcista
- Solo patrones bajistas en tendencia bajista
- Opuesto: Solo muestra patrones que VAN EN CONTRA de la tendencia identificada 🔄
-
- Patrones alcistas en tendencia bajista (reversión mayor)
- Patrones bajistas en tendencia alcista (reversión mayor)
Resumen
It operates in three phases: pattern detection, confirmation or invalidation based on the next candle's behavior, and establishing active support or resistance zones that extend while price respects them. The indicator supports configurable pattern modes (Normal, Enhanced, or All) to control acceptance criteria for reversals.
Trend filtering is available through four methods—Moving Average Cloud, Supertrend, Donchian Channels, or no filter—allowing users to align pattern signals with overall market trends or capture counter-trend reversals. Confirmed reversal zones are displayed as shaded rectangles or levels, customizable in color for bullish and bearish signals, trend filters, and zones.
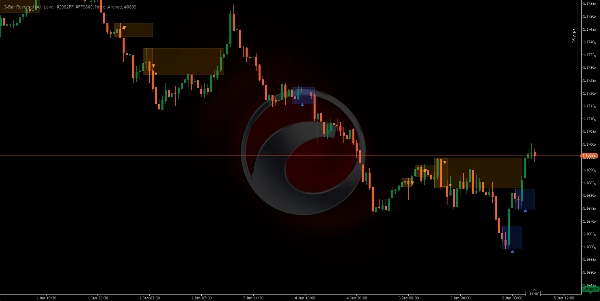
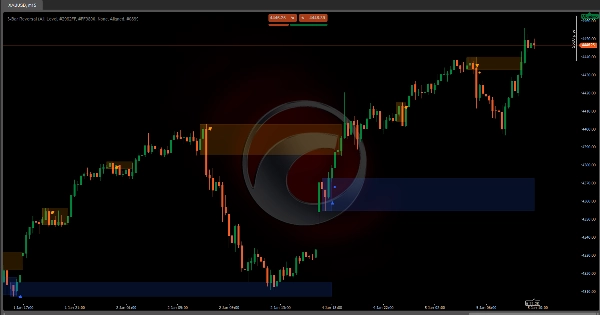
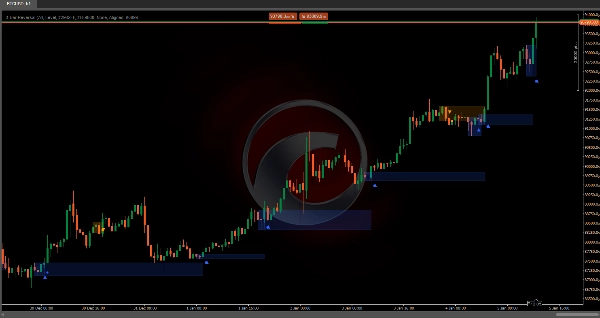
This tool is designed for use on any timeframe and across various markets, including forex pairs (EURUSD, GBPUSD, USDJPY, NZDUSD), commodities (XAUUSD), indices (NAS100), and cryptocurrencies (BTCUSD). It aids traders in detecting high-probability reversals, filtering false signals, and identifying support and resistance zones with clear visual markers.


