
Descripción
🚀 Herramienta de Dibujo de Zonas HF de EGO: Zonas Rápidas como un Rayo y Perfectas en Píxeles
¿Cansado de luchar con las herramientas nativas de gráficos? ¿Pasando demasiado tiempo arrastrando rectángulos manualmente en lugar de analizar realmente el mercado? Conoce tu nueva ventaja injusta.
La Herramienta de Dibujo de Zonas HF de EGO es una utilidad premium impulsada por teclas rápidas diseñada para automatizar y acelerar por completo tu rutina de marcado de gráficos. Dibuja, edita y gestiona tus zonas de trading sin fricciones y con precisión matemática.
📊 Qué Datos del Mercado Analiza
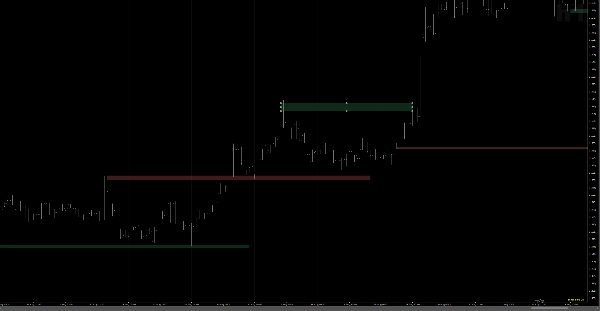
Esto no es una herramienta básica de dibujo. El indicador analiza instantáneamente datos de velas OHLC (Apertura, Máximo, Mínimo, Cierre) en tiempo real donde está posicionado tu ratón. Calcula el spread exacto entre el cuerpo y la mecha de la vela, generando automáticamente una zona perfecta en píxeles que se ajusta precisamente a los datos del mercado. ¡No más hacer zoom para corregir bordes desordenados!
🎨 Interpretación de Señales y Visuales
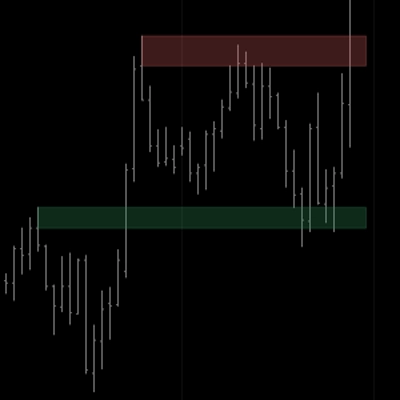
La herramienta automatiza completamente tu codificación por colores. Basándose en la dirección de la vela subyacente, asigna instantáneamente un Alcista (por ejemplo, Demanda / Soporte) o un tema de color Bajista (por ejemplo, Oferta / Resistencia).
- Zona Verde/Alcista: Dibujada automáticamente en velas alcistas.
- Zona Roja/Bajista: Dibujada automáticamente en velas bajistas. ¿Necesitas cambiar el sesgo? Un doble clic simple en la zona cambia instantáneamente su color.
⚙️ Configuraciones Clave y Teclas Rápidas (La Magia)
La velocidad lo es todo. Hemos reemplazado menús tediosos con combinaciones intuitivas de teclado y ratón:
- Doble clic o Shift + clic (en espacio vacío): Crea instantáneamente una nueva zona perfectamente ajustada a la vela bajo tu cursor.
- Doble clic (en una zona): Cambia el color de la zona (Alcista ↔ Bajista).
- Alt + clic (en una zona): Extiende instantáneamente la zona hacia el futuro por el número de barras predefinido.
- Ctrl + clic (en una zona): Reajusta la zona con precisión a su vela de origen.
- Shift + clic (en una zona): Elimina la zona instantáneamente.
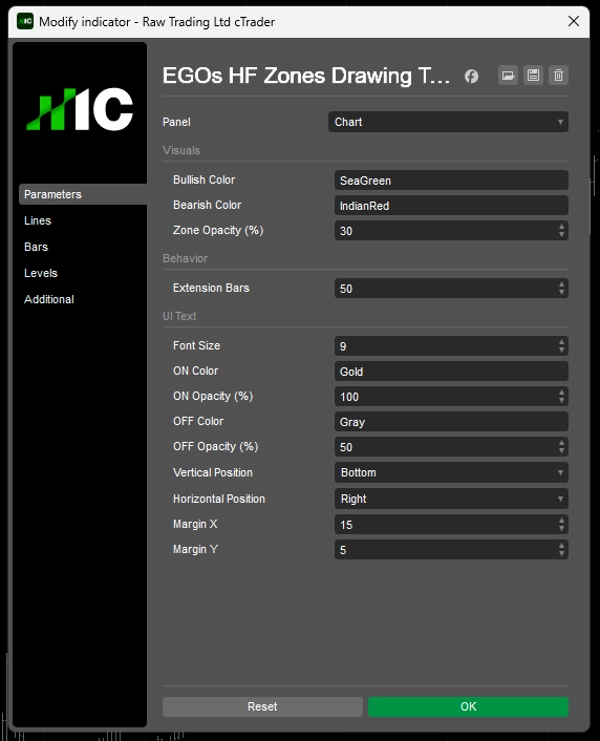
- Personalización: Colores totalmente ajustables, opacidad del 0-100% y posicionamiento personalizado del texto en la interfaz. Presiona 'H' en tu teclado para mostrar una hoja de trucos elegante en el gráfico y nunca olvidar un atajo.
🎯 Casos de Uso Típicos y Escenarios de Trading
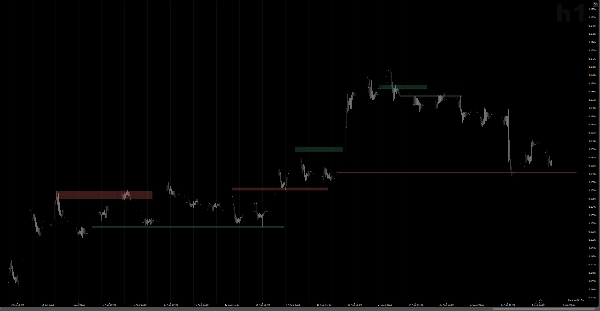
Construido específicamente para Análisis de Arriba hacia Abajo. Ya sea que estés mapeando tendencias macro Mensuales/Semanales o refinando áreas de ejecución H1, esta herramienta reduce el tiempo de marcado de gráficos en un 80%. Es el mejor compañero absoluto para dibujar:
- Zonas de Oferta y Demanda
- Bloques de Orden (OB) y Brechas de Valor Justo (FVG)
- Niveles Clave de Soporte y Resistencia
- Zonas de Confluencia para entradas por ruptura o retroceso.
👤 ¿Para Quién Es Este Indicador?
Si tu estrategia depende de zonas, esto es obligatorio para tu conjunto de herramientas.
- Traders SMC (Conceptos de Dinero Inteligente) y de Acción del Precio: Que necesitan Bloques de Orden quirúrgicamente precisos.
- Traders Swing y de Posición: Que manejan múltiples gráficos y marcos temporales y quieren mantener su espacio de trabajo limpio y eficiente.
- Nivel de Experiencia: Desde principiantes que quieren gráficos más limpios y sin errores, hasta profesionales experimentados que valoran su tiempo y exigen eficiencia.
⚠️ Notas Importantes y Limitaciones
Para asegurar un rendimiento ultrarrápido y evitar conflictos con las propiedades nativas de doble clic de cTrader, la herramienta opera con una brillante función de Modo Edición.
- Edición de Zonas: APAGADO (Por Defecto): Las zonas están bloqueadas en su lugar. Tus teclas rápidas (cambio de color, extender, eliminar) funcionan instantáneamente sin mover accidentalmente la zona.
- Edición de Zonas: ACTIVADO (Presiona
Shift Derecho): Las zonas se "desbloquean". Ahora puedes usar funciones nativas de cTrader para arrastrar, estirar o mover esquinas manualmente con el ratón.
Deja de dibujar rectángulos manualmente. Automatiza tu rutina, elimina errores de píxeles y opera con precisión absoluta. ¡Obtén hoy la Herramienta de Dibujo de Zonas HF de EGO!
Resumen
Key features include instant zone creation, resizing, extending, deleting, and re-snapping using intuitive keyboard and mouse shortcuts, eliminating manual rectangle drawing. Users can customize colors, opacity, and text positioning, with an on-chart shortcut reference available.
The tool supports top-down analysis across multiple timeframes, facilitating the marking of supply and demand zones, order blocks, fair value gaps, key support and resistance levels, and confluence zones for breakout or pullback entries. It is suitable for Smart Money Concepts and price action traders, swing and position traders, and users of all experience levels seeking precise, efficient chart markup.
An Edit Mode allows toggling between locked zones for quick hotkey actions and unlocked zones for manual adjustments using native chart functions. This indicator is optimized for cTrader and focuses on visual zone drawing based on bar data.