Oscillateur Avancé du Canal de Cycle de Hurst — Description de l'Indicateur
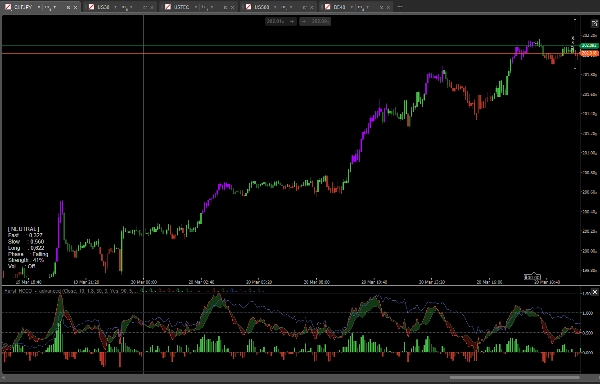
L'Oscillateur Avancé du Canal de Cycle de Hurst est un indicateur professionnel multi-cycle de momentum pour cTrader basé sur les principes de la théorie des cycles de Hurst. Au lieu de mesurer le momentum brut des prix, il positionne le prix actuel à l'intérieur de canaux de cycle calculés dynamiquement, offrant aux traders une vue normalisée de la position du prix dans son mouvement cyclique naturel.
Trois Couches de Cycle
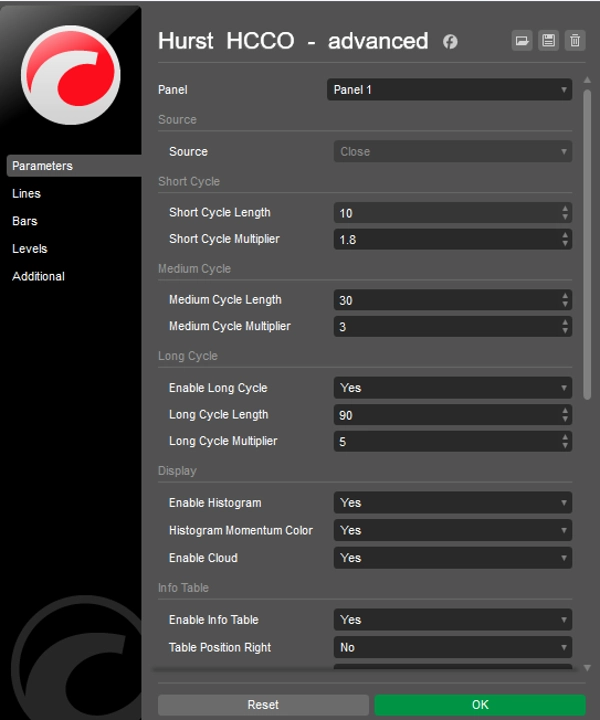
L'indicateur calcule trois canaux de cycle indépendants — Court, Moyen et Long — chacun construit à partir d'une moyenne mobile exponentielle centrée dans une enveloppe basée sur l'ATR. Les cycles Court et Moyen pilotent l'oscillateur principal, tandis que le cycle Long optionnel fournit un contexte de marché plus large. Toutes les longueurs de cycle et leurs multiplicateurs ATR sont entièrement configurables.
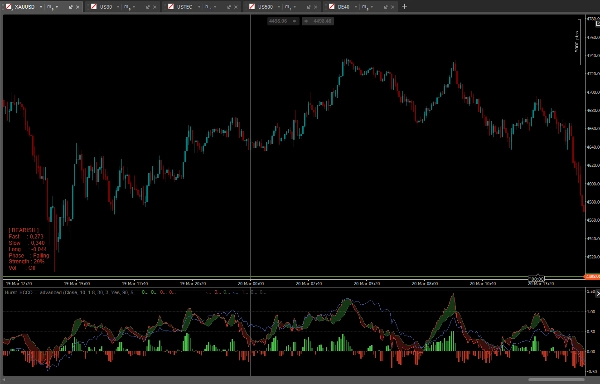
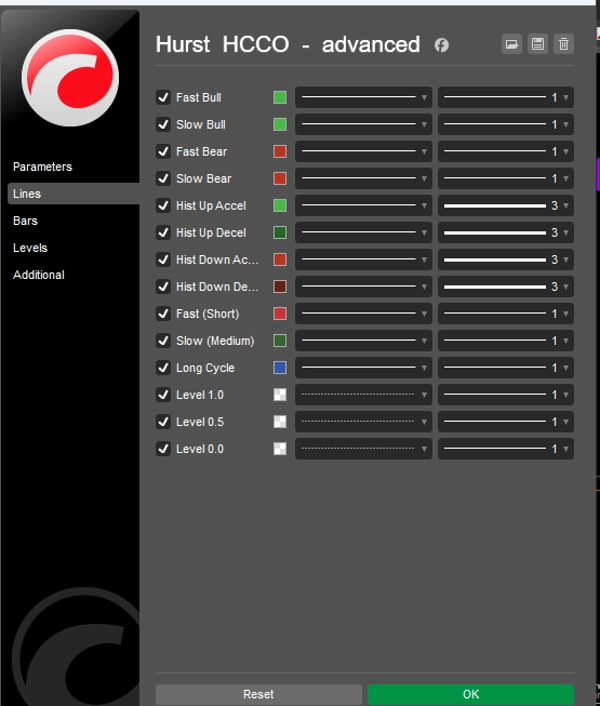
Lignes d'Oscillateur Rapide et Lent
La ligne Rapide montre où le prix actuel se situe dans le canal de cycle Moyen — une valeur supérieure à 0,5 signifie que le prix est dans la moitié supérieure de son cycle, en dessous de 0,5 dans la moitié inférieure. La ligne Lente représente le point médian du canal de cycle Court par rapport au cycle Moyen, agissant comme une référence plus lisse. Ensemble, elles créent un oscillateur à double ligne similaire dans sa structure au MACD mais basé sur la géométrie des cycles.
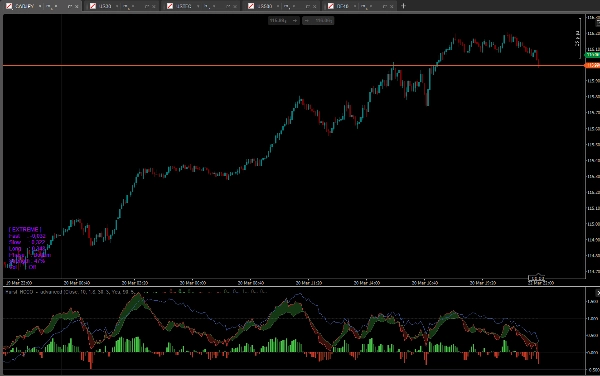
Nuage de Cycle
Un nuage optionnel remplit la zone entre les lignes Rapide et Lente. Un nuage vert se forme lorsque la ligne Rapide est au-dessus de la ligne Lente (biais cyclique haussier), un nuage rouge lorsque la ligne Rapide est en dessous de la ligne Lente (biais cyclique baissier). Le nuage rend la relation entre les deux couches de cycle immédiatement lisible.
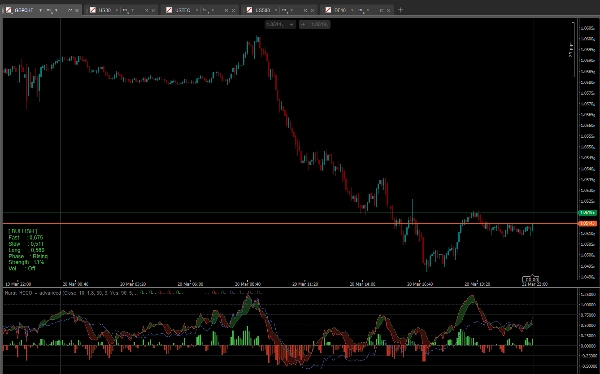
Histogramme de Momentum
L'histogramme trace la différence entre les lignes Rapide et Lente avec un codage de momentum à quatre couleurs — accélération haussière, décélération haussière, accélération baissière, décélération baissière. Cela facilite la visualisation non seulement de la direction mais aussi de savoir si le mouvement cyclique gagne ou perd de l'énergie.
Détection de Phase de Cycle
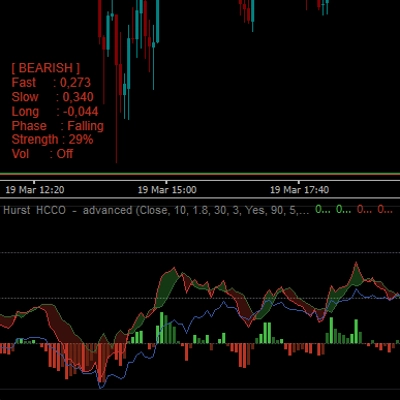
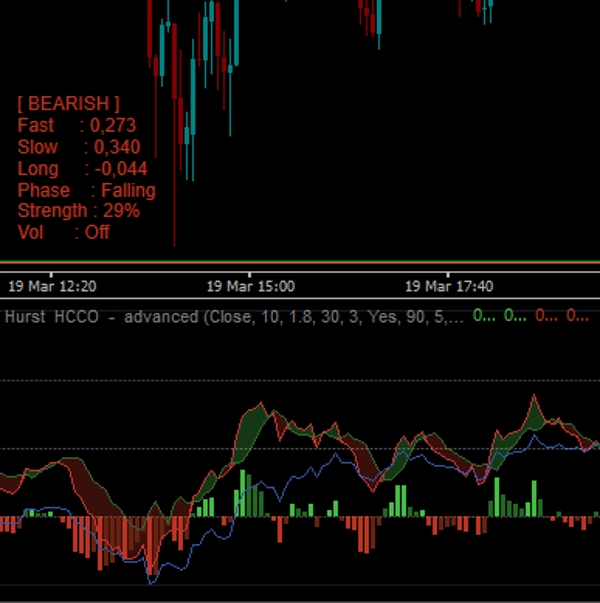
Le tableau d'information affiche la phase actuelle du cycle : Creux, Pré-Creux, Récupération, Montée, Affaiblissement, Post-Pic, Pic. Cette étiquette est dérivée directement de la valeur de l'oscillateur Rapide et de sa direction, offrant aux traders une lecture en langage clair de la position du marché dans son cycle.
Force de la Tendance
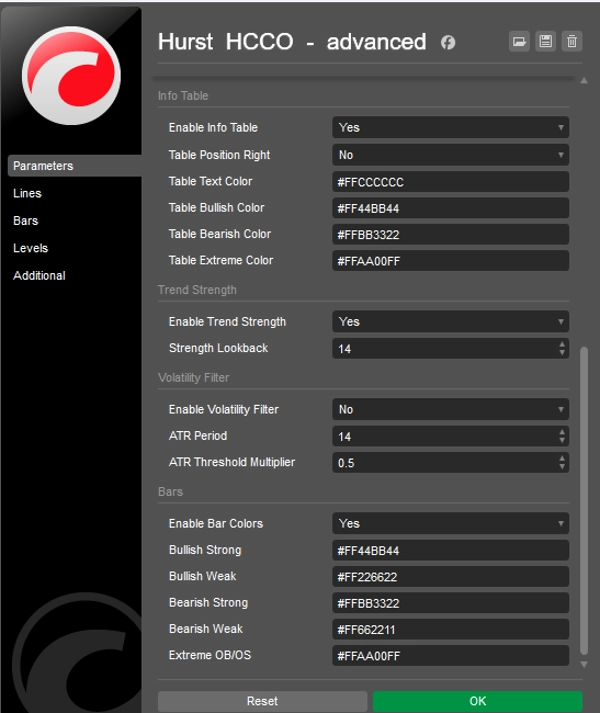
Un retour configurable calcule un score normalisé de force de tendance basé sur l'écart de la ligne Rapide par rapport au point médian 0,5. Le résultat est affiché en pourcentage dans le tableau d'information.
Filtre de Volatilité
Un filtre de volatilité optionnel basé sur l'ATR grise les barres de l'histogramme et leurs couleurs lorsque la volatilité du marché tombe en dessous d'un seuil configurable, empêchant l'oscillateur de générer des signaux trompeurs durant des conditions plates ou agitées.
Tableau d'Information
Un tableau compact sur le graphique montre l'état actuel du marché (Haussier, Baissier, Neutre, Extrême), les valeurs des oscillateurs Rapide, Lente et Long, la phase du cycle, le pourcentage de force de tendance et le statut du filtre de volatilité. La position et toutes les couleurs sont configurables.
Coloration des Barres
Lorsqu'elle est activée, les chandeliers du graphique sont colorés en fonction de l'état de l'oscillateur — haussier fort, haussier faible, baissier faible, baissier fort, et surachat/survente extrême. Les lectures extrêmes se produisent lorsque la ligne Rapide sort de la plage 0,0–1,0, signalant une cassure de prix au-delà du canal de cycle.
Résumé des Caractéristiques Clés
- Trois couches de cycle configurables basées sur la théorie des cycles de Hurst
- Oscillateur double Rapide/Lent normalisé à la position dans le canal de cycle
- Nuage de cycle entre les lignes Rapide et Lente
- Histogramme de momentum à quatre couleurs
- Détection automatique de phase de cycle avec étiquettes en langage clair
- Pourcentage de force de tendance en temps réel
- Filtre de volatilité basé sur l'ATR
- Tableau d'information sur le graphique avec décomposition complète de l'état du marché
- Coloration optionnelle des chandeliers
- Toutes les couleurs entièrement personnalisables avec support du canal alpha
- Pas de repeinture
5 | 100 % | |
4 | 0 % | |
3 | 0 % | |
2 | 0 % | |
1 | 0 % |


