ADX advanced
Indicateur
Version 1.0, Apr 2026
Windows, Mac
4.3
Avis : 3
Description
Système Avancé ADX Cloud & Momentum
L'Average Directional Index (ADX) standard est un outil puissant, mais soyons honnêtes : regarder trois lignes qui se croisent (+DI, -DI et ADX) est désordonné, déroutant et fatigue les yeux.
L'indicateur avancé ADX modernise complètement cet outil classique. Il transforme les lignes chaotiques en une puissance visuelle claire qui vous indique exactement QUI contrôle (Bulls vs. Bears) et À QUELLE FORCE la tendance est, le tout en un seul coup d'œil.
Caractéristiques clés
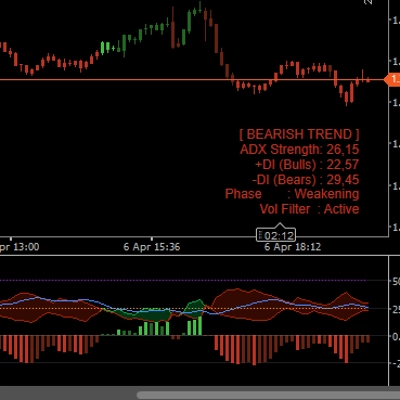
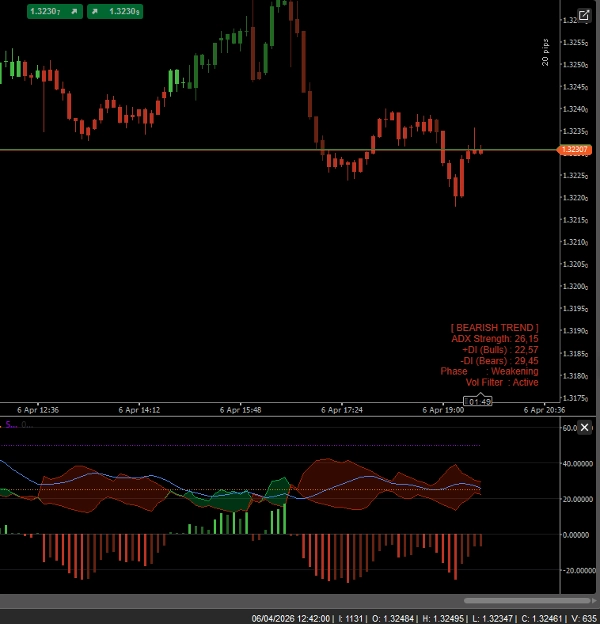
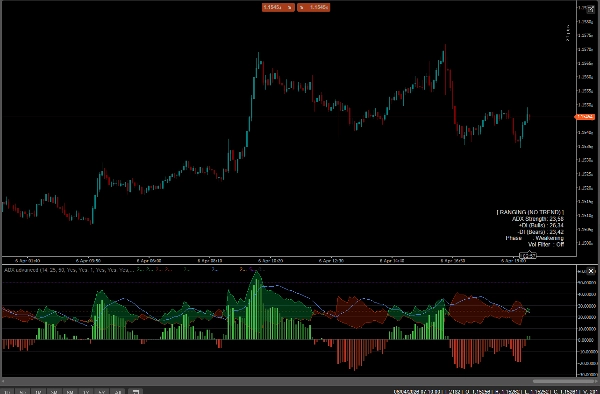
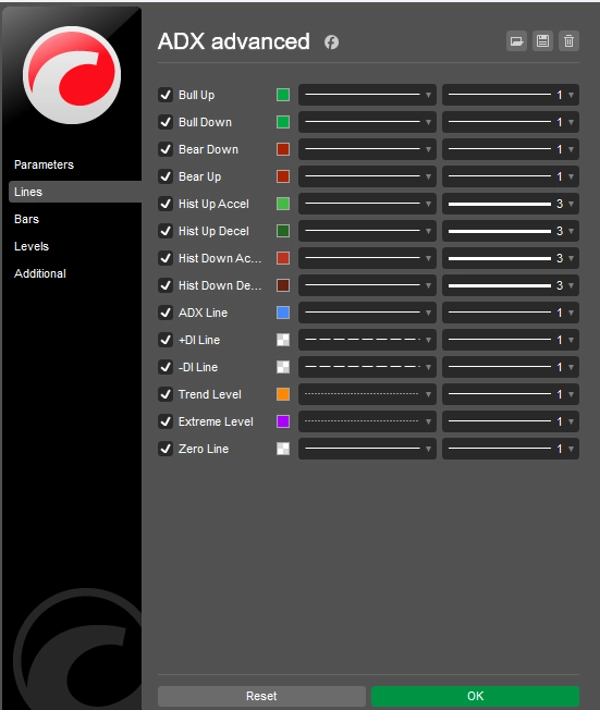
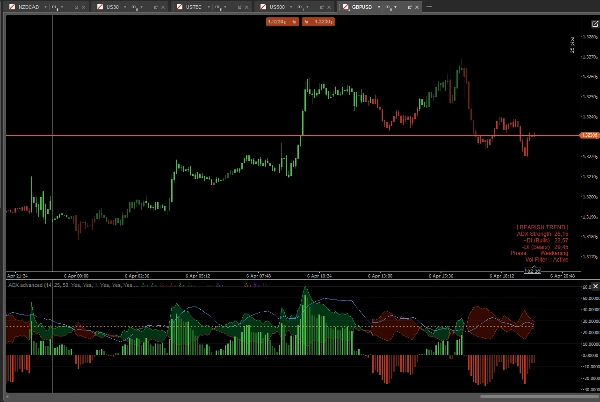
- Nuages directionnels (DI Cloud) : Au lieu de lignes qui se croisent, l'espace entre +DI et -DI est rempli d'un nuage de couleur dynamique. Nuage vert = Bulls aux commandes. Nuage rouge = Bears aux commandes.
- Histogramme de momentum : Un histogramme personnalisé en bas de l'indicateur mesure la distance exacte entre +DI et -DI. Il présente des couleurs d'accélération/décélération, vous permettant de repérer un affaiblissement du momentum avant que la tendance ne s'inverse réellement.
- Coloration intelligente des barres (Paintbars) : L'indicateur colore directement vos chandeliers en fonction de la force de la tendance !
-
- Vert/Rouge vif : Tendance forte (ADX > 25 & alignement +DI/-DI)
- Vert/Rouge foncé : Tendance faible / En range (ADX < 25)
- Violet/Magenta : Tendance extrême surétendue (ADX > 50) - Préparez-vous à un repli !
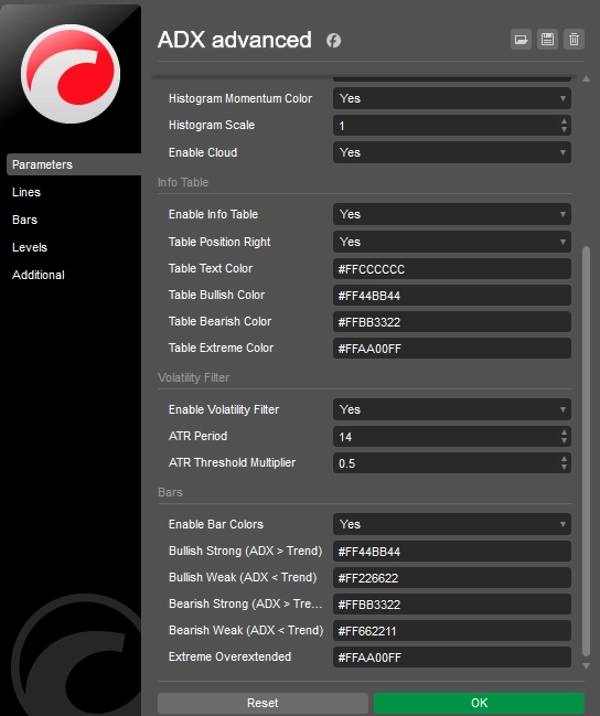
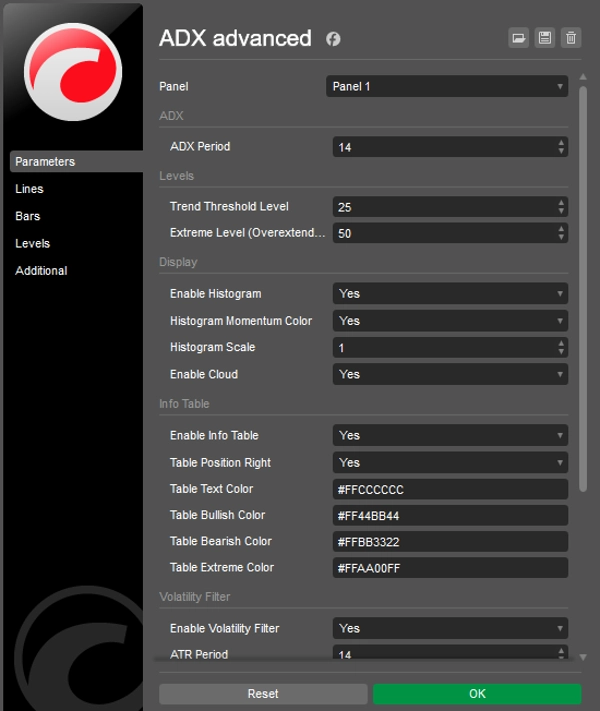
- Panneau d'information sur le graphique : Un tableau de bord élégant et non intrusif affiche en temps réel l'état actuel du marché (Tendance, Range, Extrême), la force de l'ADX et la phase du momentum.
- Filtre de volatilité intégré (ATR) : Filtre ATR optionnel qui grise les chandeliers et les barres de l'histogramme lorsque le marché est complètement plat, vous évitant de trader dans un marché choppé.
- Entièrement personnalisable : Changez les couleurs, les seuils (niveau de tendance 25, niveau extrême 50) et l'échelle de l'histogramme pour adapter à votre style de trading personnel et au thème du graphique.
Comment l'utiliser ?
- Attendez que la ligne bleue ADX franchisse le seuil de 25 (la tendance est active).
- Regardez le Nuage et l'Histogramme pour confirmer la direction (Vert pour Long, Rouge pour Short).
- Tradez les cassures et suivez la tendance tant que les chandeliers sont colorés en couleurs "Fortes".
- Prenez des profits ou déplacez les stops lorsque la ligne ADX franchit le niveau extrême de 50 (les chandeliers deviennent violets).
Résumé
Profil de l'indicateur
Avis clients
4.3
Avis : 3
5 | 33 % | |
4 | 67 % | |
3 | 0 % | |
2 | 0 % | |
1 | 0 % |
Avis clients
April 16, 2026
April 12, 2026
Discussion
Questions fréquentes
BTCUSD
Forex
Signal
Indices
EURUSD
Commodities
GBPUSD
NZDUSD
Prop
XAUUSD
NAS100
ATR
USDJPY
Les produits disponibles sur cTrader Store, notamment les bots de trading, les indicateurs et les plug-ins, sont fournis par des développeurs tiers et mis à disposition à titre informatif et à des fins d'accès technique uniquement. cTrader Store n'est pas un courtier et ne fournit aucun conseil en investissement, aucune recommandation personnelle ni aucune garantie quant aux performances futures.


Prix
24
Ventes
677
Installations gratuites