
Stochastic_advanced
Indicateur
Version 1.0, Apr 2026
Windows, Mac
4.2
Avis : 4

32
Ventes
993
Installations gratuites
Description
Système Avancé Stochastique Cloud & Momentum (VERSION COMPLÈTE)
L'oscillateur stochastique classique est un outil légendaire pour capter les retournements de marché et les changements de momentum, mais lire deux lignes fines et emmêlées en bas de votre écran peut être visuellement déroutant.
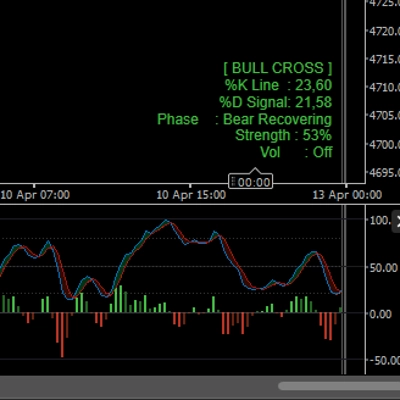
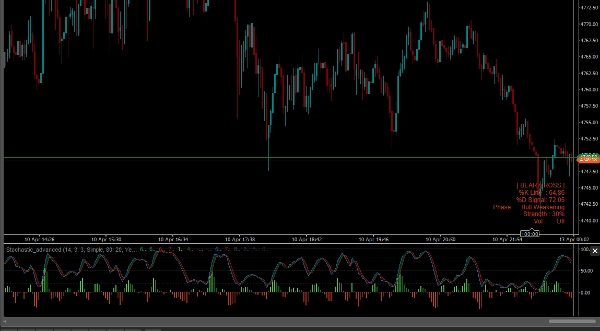
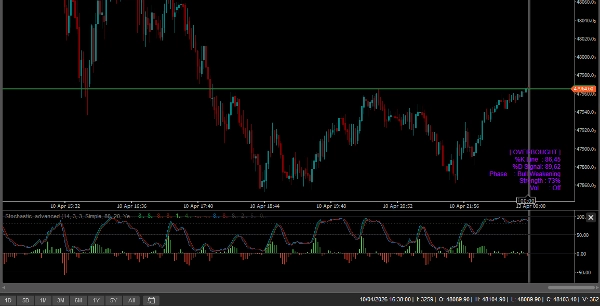
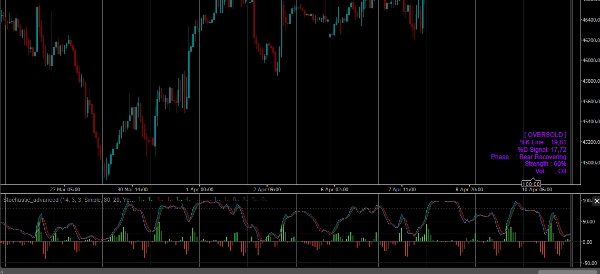
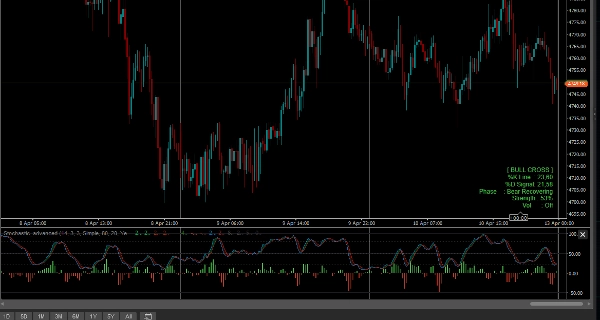
L’indicateur Stochastic Advanced révolutionne complètement cet outil traditionnel. En intégrant des Clouds visuels, un histogramme de momentum, des Paintbars intelligents et un filtre de volatilité, il transforme le Stochastique en un système de trading momentum tout-en-un très visuel.
Caractéristiques clés de la VERSION COMPLÈTE :
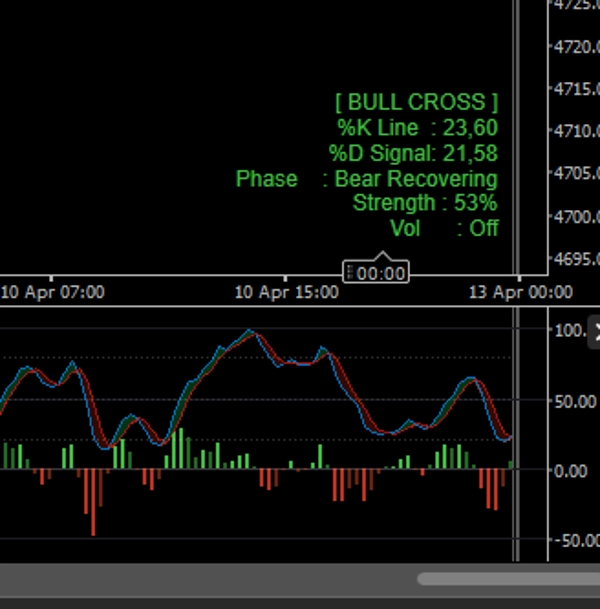
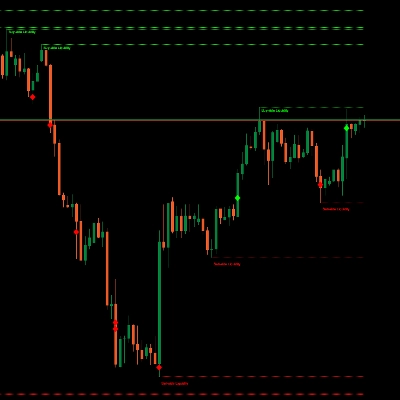
- Nuage de signal %K & %D : L’espace entre la ligne rapide (%K) et la ligne de signal lente (%D) est rempli dynamiquement par un nuage codé par couleur. Nuage vert = croisement haussier. Nuage rouge = croisement baissier. Vous ne manquerez plus jamais un signal.
- Histogramme de momentum à la ligne zéro : Un histogramme personnalisé en bas de l’indicateur mesure la distance exacte entre %K et %D. Il utilise une logique d’accélération/décélération à 4 couleurs, vous aidant à repérer les changements de momentum avant que les lignes ne se croisent réellement.
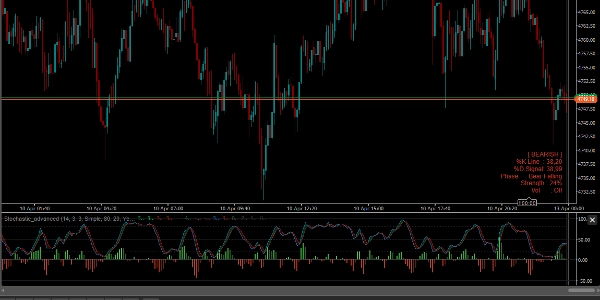
- Coloration intelligente des barres (Paintbars) : L’indicateur colore directement vos chandeliers pour correspondre au momentum stochastique :
-
- Vert/Rouge vif : Forte alignement de tendance (le prix pousse dans la direction du croisement).
- Vert/Rouge foncé : Momentum faible ou retraits potentiels.
- Violet/Magenta : Niveaux extrêmes de surachat (OB) ou de survente (OS) – vous alertant de vous préparer à un retournement.
- Filtre de volatilité intelligent (ATR) : Les faux signaux surviennent souvent dans les marchés plats et en range. Activez le filtre de volatilité ATR intégré pour griser automatiquement vos chandeliers et histogramme lorsque la volatilité du marché diminue. S’il est gris, restez à l’écart !
- Tableau de bord d’informations en temps réel : Un panneau clair sur le graphique affiche l’état actuel du marché, les valeurs exactes %K/%D, la force de la tendance et le statut de la volatilité en un coup d’œil.
- Complètement débloqué : Tradez sur N’IMPORTE quel symbole (Forex, Crypto, Indices, Actions) et N’IMPORTE quel intervalle de temps sans aucune limitation. Accès à vie.
Comment trader avec ?
- Le retournement : Attendez que les chandeliers deviennent violets (entrée dans les zones extrêmes OB/OS). Préparez-vous à trader. Une fois que le nuage stochastique change de couleur (par exemple, du rouge au vert) et que l’histogramme accélère, exécutez votre trade.
- La continuation de tendance : Pendant une tendance active, attendez un retracement où %K baisse mais se récupère rapidement. Une barre d’histogramme brillante combinée à un chandelier de prix vivement coloré signale une entrée forte en continuation.
- Éviter le chop : Si le filtre de volatilité grise vos barres, ne prenez pas les signaux de croisement. Attendez que le volume et la volatilité reviennent
Résumé
Résumé IA
Stochastic Advanced is an enhanced momentum indicator that transforms the classic Stochastic Oscillator into a visually intuitive trading system. It features a dynamic %K and %D Signal Cloud that color-codes bullish and bearish crossovers, making signals easier to identify. A Zero-Line Momentum Histogram uses a four-color scheme to indicate acceleration and deceleration in momentum, helping traders anticipate shifts before line crossovers occur.
The indicator also includes Smart Bar Coloring (paintbars) that visually align price candles with momentum strength and trend direction, using distinct colors to denote strong trends, weak momentum, and extreme overbought or oversold conditions. A built-in Smart Volatility Filter based on Average True Range (ATR) grays out candles and histogram bars during low volatility periods to help avoid false signals in ranging markets.
An on-chart Real-Time Info Dashboard displays current market state, exact %K/%D values, trend strength, and volatility status for quick assessment. The indicator supports all symbols—including Forex, cryptocurrencies, indices, and stocks—and any timeframe without limitations. It is designed for use in reversal and trend continuation strategies while providing chop avoidance through volatility filtering.
Profil de l'indicateur
Catégorie de l'indicateur
Volatilité
Type de résultat
Signaux
Filtre
Exigences en matière de données
Barres seulement
Signaux pris en charge
Puissance de la tendance
Volatilité
Discussion
Avis clients
4.2
Avis : 4
5 | 25 % | |
4 | 75 % | |
3 | 0 % | |
2 | 0 % | |
1 | 0 % |
Avis clients
April 26, 2026
The first thing that worked was the signal needs a real reason behind it, and the first test should keep DD under 3 percent.
April 24, 2026
What stood out was confusing signals get easier to ignore. Strong trends can keep readings stretched.
April 15, 2026
The logic holds up when bad ideas get easier to avoid, and Overconfidence is the real danger.
April 12, 2026
Questions fréquentes
ATR
Stochastic
Les produits disponibles sur cTrader Store, notamment les bots de trading, les indicateurs et les plug-ins, sont fournis par des développeurs tiers et mis à disposition à titre informatif et à des fins d'accès technique uniquement. cTrader Store n'est pas un courtier et ne fournit aucun conseil en investissement, aucune recommandation personnelle ni aucune garantie quant aux performances futures.








Prix
32
Ventes
993
Installations gratuites