Description
DÉTECTEUR DE HAUTS ET BAS DE SWING
Détection de Swing avec Analyse de Divergence
--------------------------------------------------
Identifiez les swings. Repérez les divergences. Tradez avec confluence.
--------------------------------------------------
CE QUE CET INDICATEUR FAIT
Cet indicateur détecte automatiquement les hauts et bas structurels de swing en utilisant une profondeur configurable et un filtrage par déviation. Il analyse ensuite le RSI et le MACD pour détecter les divergences régulières et cachées entre des swings consécutifs du même type.
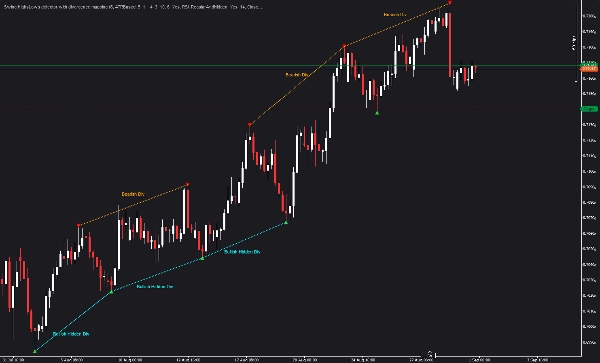
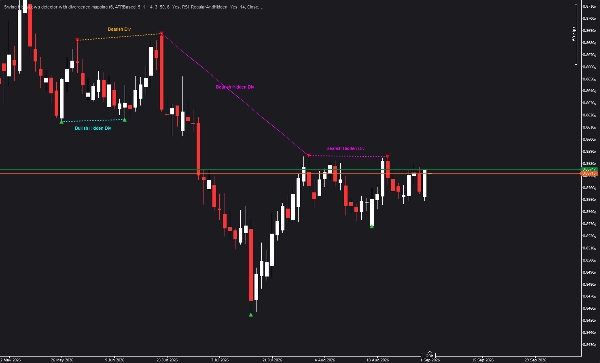
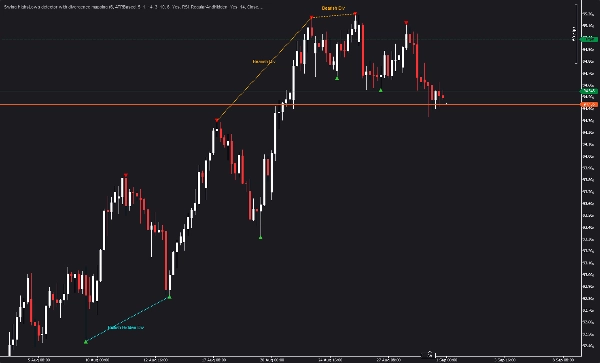
Les divergences sont des signaux puissants de retournement. La divergence régulière indique un potentiel retournement de tendance, tandis que la divergence cachée indique une possible continuation de tendance. Cet indicateur identifie les deux et les affiche directement sur votre graphique.
--------------------------------------------------
LOGIQUE ET CALCULS PRINCIPAUX
L'indicateur détecte les points de swing en utilisant un algorithme d'extrêmes locaux avec une profondeur configurable. Chaque point de swing est validé selon un seuil de déviation, garantissant que seuls les swings significatifs sont affichés. La déviation peut être fixe en pips ou adaptative à la volatilité via l'ATR.
Une fois les swings identifiés, l'indicateur calcule les valeurs RSI et MACD à chaque point de swing. Il compare ensuite les swings consécutifs du même type (haut à haut, bas à bas) pour détecter les divergences régulières et cachées. La divergence régulière se produit lorsque le prix fait un plus haut plus élevé mais que le RSI/MACD fait un plus haut plus bas (baissier) ou lorsque le prix fait un plus bas plus bas mais que le RSI/MACD fait un plus bas plus élevé (haussier). La divergence cachée se produit lorsque le prix fait un plus haut plus bas mais que le RSI/MACD fait un plus haut plus élevé (baissier) ou lorsque le prix fait un plus bas plus élevé mais que le RSI/MACD fait un plus bas plus bas (haussier).
La source de divergence peut être sélectionnée entre RSI, MACD, ou les deux. Le type de divergence peut être uniquement régulière, uniquement cachée, ou les deux. Les swings non confirmés peuvent être inclus dans la détection des divergences, fournissant des signaux plus précoces.
La machine d'état actuelle des swings suit les swings non confirmés (U) qui sont encore en formation. Ces swings apparaissent en jaune et peuvent être promus en confirmés ou invalidés au fur et à mesure de l'évolution de l'action des prix.
--------------------------------------------------
FONCTIONNALITÉS CLÉS
- DÉTECTION AUTOMATIQUE DE SWING : Identifie les hauts et bas de swing en utilisant une profondeur configurable et un filtrage par déviation.
- DÉTECTION DE DIVERGENCE RÉGULIÈRE : Identifie les signaux classiques de divergence indiquant un potentiel retournement de tendance.
- DÉTECTION DE DIVERGENCE CACHÉE : Identifie les signaux de divergence cachée indiquant une possible continuation de tendance.
- DIVERGENCE RSI ET MACD : Choisissez RSI, MACD, ou les deux comme source de divergence.
- DÉVIATION CONFIGURABLE : Déviation fixe en pips ou basée sur l'ATR qui s'adapte à la volatilité du marché.
- SUIVI DES SWINGS NON CONFIRMÉS : Affiche les swings potentiels (U) pendant leur formation.
- CONTRÔLE DE RETOUR EN ARRIÈRE : Limite le nombre de points de swing affichés pour optimiser les performances.
- COULEURS PERSONNALISABLES : Couleurs distinctes pour les hauts confirmés, bas confirmés, swings non confirmés, et types de divergence.
- PAS DE REPEINTURE : Tous les calculs sont basés sur des données historiques.
--------------------------------------------------
GUIDE DES PARAMÈTRES
PARAMÈTRES DE SWING
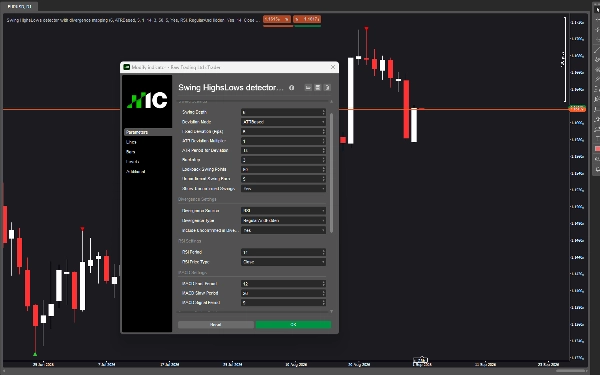
Profondeur de Swing : Ce paramètre contrôle le nombre de barres vérifiées de chaque côté d'une barre pour déterminer si c'est un haut ou un bas de swing. Des valeurs plus élevées produisent moins de swings, mais plus significatifs. Des valeurs plus basses produisent plus de swings. La valeur par défaut est 10. Pour des unités de temps plus basses comme M5 et M15, envisagez d'utiliser 6 à 8. Pour des unités de temps plus élevées comme H4 et plus, envisagez d'utiliser 12 à 16.
Mode de Déviation : Ce paramètre sélectionne entre Pips Fixes et déviation basée sur l'ATR. Les Pips Fixes utilisent une distance de prix minimale constante entre les swings. Le mode basé sur l'ATR s'adapte à la volatilité en utilisant un multiplicateur de la valeur ATR actuelle. La valeur par défaut est Pips Fixes.
Déviation Fixe (Pips) : En mode Pips Fixes, ce paramètre définit la distance minimale en pips entre les swings consécutifs. La valeur par défaut est 5.0. Augmentez cette valeur pour filtrer les swings plus petits et vous concentrer sur les mouvements structurels plus importants. Diminuez-la pour capturer plus de swings.
Multiplicateur de Déviation ATR : En mode basé sur l'ATR, ce paramètre multiplie la valeur ATR actuelle pour déterminer la déviation minimale. La valeur par défaut est 0.5. Des valeurs plus élevées produisent moins de swings. Des valeurs plus basses produisent plus de swings.
Période ATR pour la Déviation : En mode basé sur l'ATR, ce paramètre définit la période pour le calcul de l'ATR. La valeur par défaut est 14. Des périodes plus courtes produisent des valeurs ATR plus réactives. Des périodes plus longues produisent des valeurs plus lisses.
Backstep : Ce paramètre définit le nombre minimum de barres entre les swings. La valeur par défaut est 3. Augmentez cette valeur pour éviter que les swings apparaissent trop proches les uns des autres. Diminuez-la pour permettre des swings plus fréquents.
Points de Swing en Retour : Ce paramètre limite le nombre de points de swing affichés pour optimiser les performances. La valeur par défaut est 50. Augmentez pour plus de contexte historique. Diminuez pour une meilleure performance sur des machines plus lentes.
Barres de Swing Non Confirmées : Ce paramètre définit combien de barres après un swing potentiel l'indicateur recherche un meilleur candidat. La valeur par défaut est 3. Des valeurs plus élevées permettent plus de temps pour qu'un meilleur swing se forme. Des valeurs plus basses produisent des signaux plus rapides.
Afficher les Swings Non Confirmés : Lorsqu'activé, les swings potentiels (U) sont affichés en jaune avant d'être confirmés. La valeur par défaut est true. Désactivez pour un graphique plus épuré montrant uniquement les swings confirmés.
PARAMÈTRES DE DIVERGENCE
Source de Divergence : Ce paramètre sélectionne l'indicateur utilisé pour la détection de divergence. Les options sont RSI, MACD, ou RSIAndMACD. RSIAndMACD nécessite que les deux indicateurs montrent une divergence pour qu'un signal soit généré. La valeur par défaut est RSI.
Type de Divergence : Ce paramètre sélectionne les types de divergence à détecter. Les options sont RegularOnly, HiddenOnly, ou RegularAndHidden. La valeur par défaut est RegularAndHidden.
Inclure les Non Confirmés dans la Divergence : Lorsqu'activé, les swings non confirmés peuvent être utilisés comme swing actuel dans la détection de divergence. La valeur par défaut est true. Désactivez pour exiger que les deux swings soient pleinement confirmés avant d'afficher la divergence.
PARAMÈTRES RSI
Période RSI : Ce paramètre définit la période pour le calcul du RSI. La valeur par défaut est 14. Les valeurs standard varient de 9 à 25. Des périodes plus courtes produisent des valeurs RSI plus sensibles. Des périodes plus longues produisent des valeurs plus lisses.
Type de Prix RSI : Ce paramètre sélectionne la série de prix utilisée pour le calcul du RSI. Les options incluent Close, Open, High, Low, Typical, Median, et Weighted. La valeur par défaut est Close.
PARAMÈTRES MACD
Période Rapide MACD : Ce paramètre définit la période EMA rapide pour le calcul du MACD. La valeur par défaut est 12.
Période Lente MACD : Ce paramètre définit la période EMA lente pour le calcul du MACD. La valeur par défaut est 26.
Période Signal MACD : Ce paramètre définit la période de la ligne de signal pour le calcul du MACD. La valeur par défaut est 9.
VISUELS
Couleur des Hauts de Swing : Couleur pour les hauts de swing confirmés. Par défaut Rouge.
Couleur des Bas de Swing : Couleur pour les bas de swing confirmés. Par défaut Vert Citron.
Couleur des Hauts de Swing Non Confirmés : Couleur pour les hauts de swing non confirmés (U). Par défaut Jaune.
Couleur des Bas de Swing Non Confirmés : Couleur pour les bas de swing non confirmés (U). Par défaut Jaune.
Couleur de la Divergence Régulière Haussière : Couleur pour les lignes de divergence régulière haussière. Par défaut Bleu Dodger.
Couleur de la Divergence Régulière Baissière : Couleur pour les lignes de divergence régulière baissière. Par défaut Orange.
Couleur de la Divergence Cachée Haussière : Couleur pour les lignes de divergence cachée haussière. Par défaut Cyan.
Couleur de la Divergence Cachée Baissière : Couleur pour les lignes de divergence cachée baissière. Par défaut Magenta.
Afficher les Étiquettes : Lorsqu'activé, les étiquettes de divergence sont affichées sur le graphique. La valeur par défaut est true.
Taille de Police des Étiquettes : Ce paramètre définit la taille de la police pour les étiquettes de divergence. La valeur par défaut est 8.
Décalage de l'Étiquette de Divergence (Pips) : Ce paramètre contrôle la distance du décalage de l'étiquette de divergence par rapport à la ligne de divergence. La valeur par défaut est 10.
--------------------------------------------------
CAS D'UTILISATION
- Identifier les hauts et bas structurels de swing pour l'analyse de la structure du marché
- Détecter les divergences régulières pour des signaux potentiels de retournement
- Détecter les divergences cachées pour des signaux potentiels de continuation de tendance
- Combiner les signaux de divergence avec l'action des prix pour des trades à probabilité plus élevée
- Utiliser la confirmation de divergence RSI et MACD pour les décisions d'entrée et de sortie
- Suivre les swings non confirmés pour une détection précoce des signaux
--------------------------------------------------
FLUX DE TRAVAIL RECOMMANDÉ
Étape 1 : Attachez l'indicateur à votre graphique avec les paramètres par défaut.
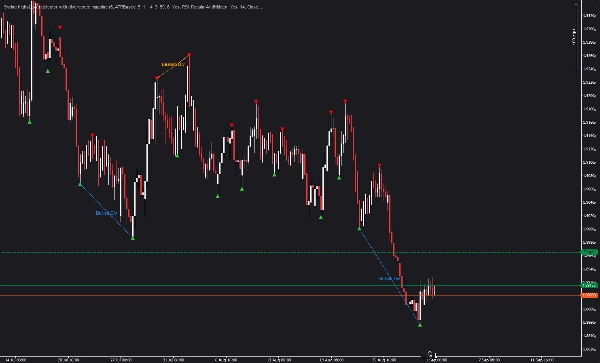
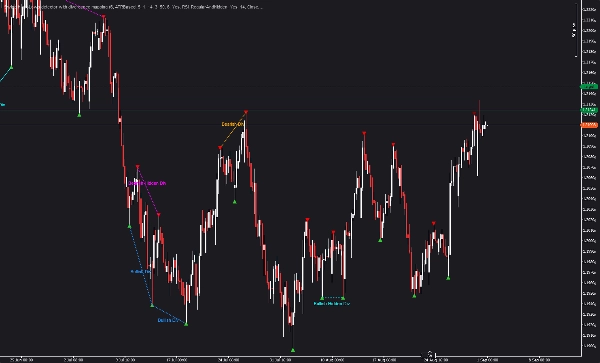
Étape 2 : Identifiez les hauts et bas de swing confirmés (triangles rouges et verts).
Étape 3 : Recherchez les lignes de divergence (bleu, orange, cyan, magenta) reliant les swings consécutifs.
Étape 4 : Interprétez les divergences régulières comme des retournements potentiels et les divergences cachées comme des continuations potentielles.
Étape 5 : Confirmez les signaux de divergence avec l'action des prix ou d'autres indicateurs avant d'entrer en position.
--------------------------------------------------
NOTES TECHNIQUES
- Indicateur en superposition qui dessine directement sur le graphique des prix
- Fonctionne sur n'importe quelle unité de temps et symbole
- Paramètres configurables pour la détection de swing et la divergence
- Pas de repeinture ; tous les calculs sont basés sur des données historiques
- Optimisé pour la performance avec contrôle du retour en arrière
- Compatible avec cTrader
--------------------------------------------------
SUPPORT
Mises à jour à vie incluses.
POUR PLUS D'INFORMATIONS - Cliquez sur le profil du développeur ci-dessous.