present
Inscrivez-vous et bénéficiez d'une remise de 50 $ sur votre premier achat
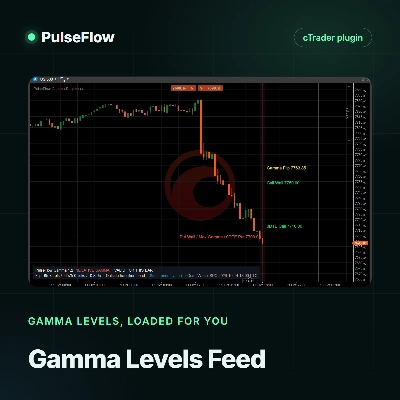
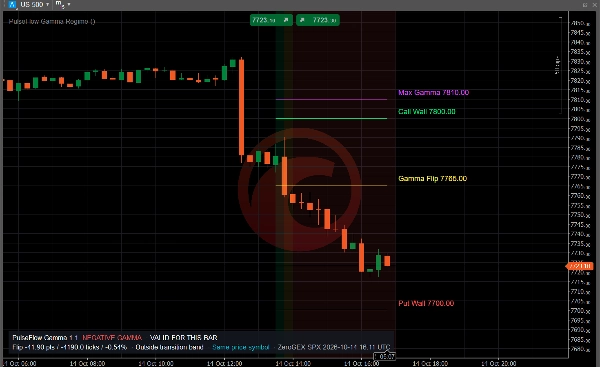
Trading product for PulseFlow Gamma Regime Indicateur Key Levels Support & Resistance, image 1
PulseFlow Gamma Regime
Indicateur
Version 1.1, Oct 2026
Windows, Mac
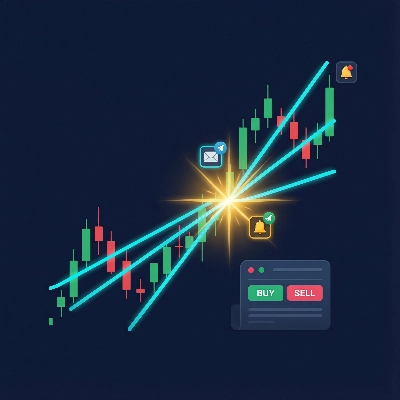
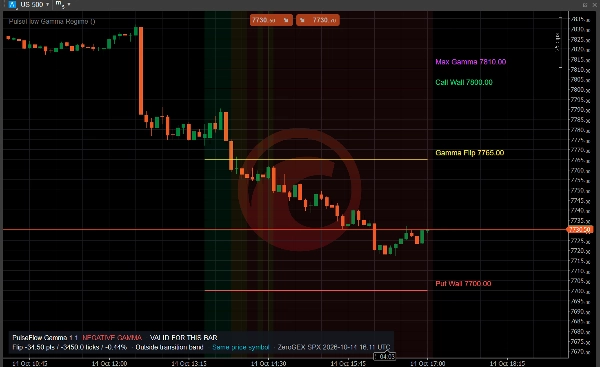
Trading product for PulseFlow Gamma Regime Indicateur Key Levels Support & Resistance, image 2
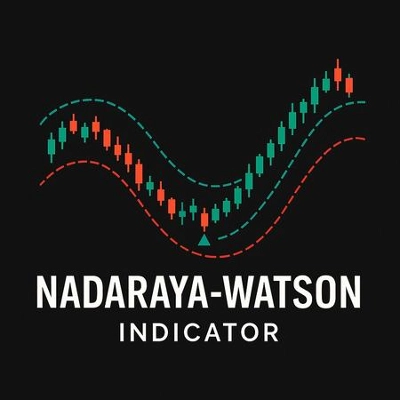
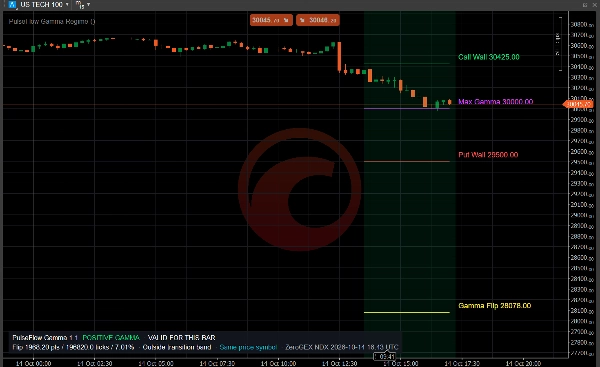
Trading product for PulseFlow Gamma Regime Indicateur Key Levels Support & Resistance, image 3
Trading product for PulseFlow Gamma Regime Indicateur Key Levels Support & Resistance, image 4
Depuis le 14/10/2026

Description

Launch price: $19 until November 14, 2026. After that date, the price returns to $33.


Stop copying gamma levels by hand


Gamma levels move during the session. Copying the Gamma Flip, the walls and the pin from a website into your chart takes time, and by the afternoon those numbers may already be old. PulseFlow Gamma Levels Feed loads them for you, so your chart keeps up with the options market while you focus on price. It helps you make better decisions with clear references.


What you get

- Gamma Flip, Call Wall, Put Wall, Max Gamma, Net GEX and the walls of the nearest expiration (0DTE), downloaded from your own QuantWheel account.

- Levels that refresh on their own: the plugin checks for new data every minute by default, and your charts follow as soon as the provider publishes an update.

- One download for all your charts: every PulseFlow Gamma Regime chart on your computer reads the same data, so requests are not multiplied.

- A history of the session: each update is kept, so past bars show the levels that applied at that time.

- Clear status on the chart: if the key is wrong, your plan has no API access or the provider is busy, the Gamma Regime panel tells you.


How it works

1. Install this plugin and the PulseFlow Gamma Regime indicator.

2. In the plugin settings, enter your QuantWheel API key and the tickers you follow, for example SPX or QQQ.

3. In the indicator, set Data source to PulseFlowFeed and choose the ticker.


Requirements

- A QuantWheel subscription with REST API access (currently the Quant plan), paid directly to QuantWheel. This plugin does not include market data.

- The PulseFlow Gamma Regime indicator, which draws the levels. It is sold separately.

- Tested on cTrader for Windows.


Data sent and received

The plugin connects only to the QuantWheel API. Each request sends your API key and the ticker; the response contains that ticker's gamma exposure profile. The levels are stored on your computer for the Gamma Regime indicator. No trading, account or personal data is sent, and nothing else leaves your device.


Type, instruments and timeframes

cTrader plugin that supplies data to an indicator. It does not trade or place orders. It covers the tickers available in QuantWheel, such as the S&P 500 index (SPX), the Nasdaq 100 index (NDX), SPY and QQQ. Levels quoted for an ETF can be mapped to an index chart with the indicator's price multiplier. The levels can be shown on any time-based chart the indicator supports; intraday charts read best.


Keep in mind

Gamma levels are modeled estimates and can differ between providers. Refresh speed depends on QuantWheel, which caches each ticker for about a minute and updates its main tickers every few minutes. CFD prices can differ slightly from the cash index the levels refer to. This is market context, not an entry or exit signal.


Trading involves risk. Past performance does not guarantee future results.

Résumé

Profil de l'indicateur
Catégorie de l'indicateur
Assistance et résistance
Type de résultat
Visualisation
Exigences en matière de données
Barres seulement
Signaux pris en charge
Atteinte du niveau
Croisement
Dépassement de niveau

Discussion

Avis clients

0.0
Avis : 0
Avis clients
Il n'y a pas encore d'avis sur ce produit. Vous l'avez déjà essayé ? Soyez le premier à en parler aux autres !

Questions fréquentes

Key Levels
Support & Resistance
Les produits disponibles sur cTrader Store, notamment les bots de trading, les indicateurs et les plug-ins, sont fournis par des développeurs tiers et mis à disposition à titre informatif et à des fins d'accès technique uniquement. cTrader Store n'est pas un courtier et ne fournit aucun conseil en investissement, aucune recommandation personnelle ni aucune garantie quant aux performances futures.

Plus de cet auteur

Indicateur
RSI
Fibonacci
+1
Spot RSI divergences on your chart and get an entry, stop and six targets when your filters line up.
Indicateur
Key Levels
Market Structure
+1
See the day's percentage targets from the open, so you know where the session stands at a glance.
Indicateur
Imbalance
Key Levels
+1
Keep open imbalance zones, untouched session highs and lows and the day's ADR range in view, without scrolling back.
Plug-in desktop
External Data
HTTP Requests
Load live gamma levels from your own QuantWheel API key into PulseFlow Gamma Regime, with no more typing by hand.

Vous pourriez aussi aimer

Indicateur
Key Levels
Order Block
+2
It monitors trend lines on price charts and fires multi-channel alerts and optionally places trades when price crosses..
Indicateur
Key Levels
Market Structure
+1
See the day's percentage targets from the open, so you know where the session stands at a glance.
Indicateur
AI
ATR
+27
Nadaraya-Watson Envelope Indicator
Logo de "ADT_bigCandles"
Les mieux notés
4.7
(4)
$20
/
$40
Indicateur
ATR
Prop
Outside Candle Detector: Highlights major candles/zones with ATR filter & pattern labels. By Avydel Talbo, prop trader.
Logo de "ORB v1.1"
Populaire
4.0
(4)
$25
Indicateur
Breakout
Opening Range Breakout v1.1 - Visuals + Stats
Indicateur
Forex
Fibonacci
+2
Enhance your trading with customizable alerts and dynamic visual tools for trendlines, Fibonacci levels, and more.
Indicateur
Auto Fibonacci Retracement Indicator for cTrader
Indicateur
ADX
ATR
+2
GOLD SENTINEL v1.0 - A CANDLE-COLORING INDICATOR FOR GOLD.
Indicateur
RSI
VegaXLR's cTrader StochRSI identifies overbought/oversold RSI levels for precise trade entries.
Indicateur
Signal
Trades Opening Range Breakouts Indicator with dynamic stops/targets adapting to market volatility.
Indicateur
Advanced price action tool that combines multiple technical analysis concepts
Indicateur
Three ZigZag lines
Indicateur
Displays the previous day's, last week's, and last month's highest and lowest price levels on your chart.
Indicateur
ADX
ATR
+5
Configure, simulate, and analyze trading strategies with custom filters, multi-target exits, and detailed performance me
Indicateur
RSI
Fibonacci
+1
Spot RSI divergences on your chart and get an entry, stop and six targets when your filters line up.
Indicateur
Forex
Detects valid Fair Value Gaps from strong 3-bar patterns. Keep drawing unfilled gaps until price fills them.
Indicateur
ATR
Prop
+13
Enhance trading with ATR Bands! Visualize market volatility using dynamic upper and lower ATR bands for precise decision
Logo de "Stochastic RSI PRO"
Les mieux notés
4.6
(6)
$28
/
$40
Indicateur
RSI
Prop
+14
Unlock Stochastic RSI PRO in cTrader! Overlay RSI, highlight zones, and identify divergences with customizable settings.

Prix

Depuis le 14/10/2026