present
Inscrivez-vous et bénéficiez d'une remise de 50 $ sur votre premier achat
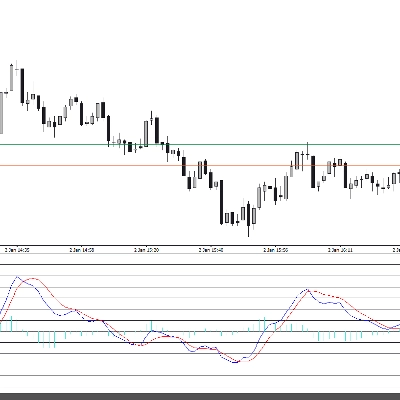
Trading product for Pivot Levels Indicateur Fibonacci Fair Value Gap, image 1
Pivot Levels
Indicateur
Version 1.1, Nov 2026
Windows, Mac
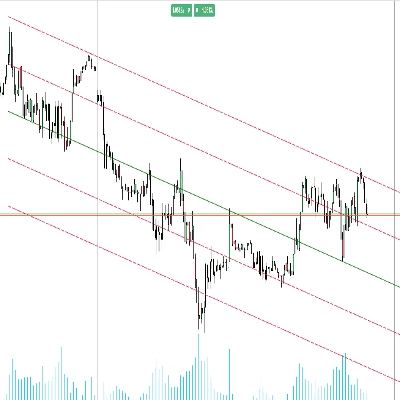
Trading product for Pivot Levels Indicateur Fibonacci Fair Value Gap, image 2
1
Installations gratuites

Description

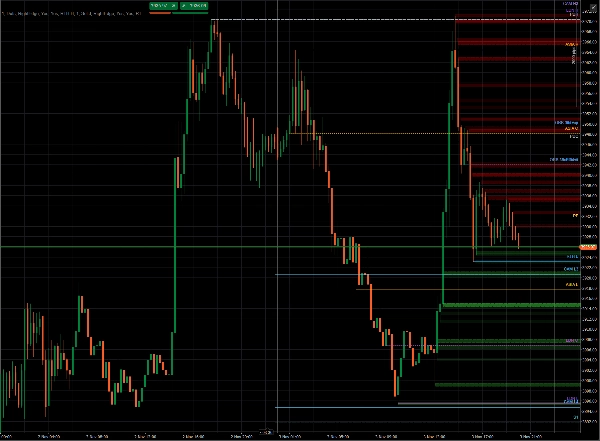
Pivot Levels: sessions, previous day and week, ORB, Floor Pivot and Camarilla

Pivot Levels puts the price levels that traders watch every day on your chart, drawn as clean rays with labels, and adds a compact table with the range of each session. It is a display-only study: it places no orders and changes nothing on your account.

What it draws

  • Today's sessions: Open, High and Low of the RTH session (09:30–16:00 New York), the Asian session (Tokyo) and the London session. Session times follow their own time zones, so daylight saving is handled for you, and you don't type any hours
  • Yesterday: Open, High, Low and Close of the previous trading day
  • Previous week: Open, High, Low and Close of the previous week.
  • Opening Range Breakout (ORB): the high ("up") and low ("down") reached in the first 15 and 30 minutes of the RTH session. Draw them only once the range has formed, or in real time while it forms
  • Floor Pivot: PP, R1, R2, S1, S2, calculated from the previous trading day
  • Camarilla: H3, H4, H5, L3, L4, L5, calculated from the previous trading day

Each line starts where its value was formed (the time of the high, the low or the open), so you can see when a level was set. Current levels extend to the right as rays. Past days can optionally be shown for review.


Session Range Monitor

A small table shows, for each session of the current trading day, its range in points and pips and an arrow for the direction of the session. The live session is highlighted. You choose the corner, the offsets and the font size.


Trading day without setup

By default the trading day is taken from your broker's own Daily bars, so rollover and daylight saving are the real ones for your server and nothing needs to be configured.

Alternatively you can use a fixed 17:00 New York day, identical across brokers. You can also compute yesterday, weekly and pivot levels on the full session or on RTH only.


Customization

  • Every level has its own switch, label, line width, line style, color (with the native color picker), label side and optional price value
  • Label position: left, right (follows the last bar), or anchored to the right or left edge of the chart, next to the Y axis, even while you scroll or zoom
  • A general switch to show labels only, or labels with values, and a label font size
  • History loads in the background, so the chart stays responsive. The data timeframe is chosen automatically from your chart and can be changed


Good to know

  • Works on any symbol and chart timeframe supported by your CFD broker's data since all levels are derived from price only
  • Levels are calculated from the data your broker provides, so values can differ slightly between brokers
  • This is an analysis tool, not trading advice. Past levels do not guarantee future price behavior


Résumé

Profil de l'indicateur
Catégorie de l'indicateur
Assistance et résistance
Type de résultat
Visualisation
Exigences en matière de données
Barres seulement
Signaux pris en charge
Cassure
Inversion
Puissance de la tendance
Volatilité
Atteinte du niveau
Dépassement de niveau
Écart d'ouverture de session
Divergence
Croisement

Discussion

Avis clients

0.0
Avis : 0
Avis clients
Il n'y a pas encore d'avis sur ce produit. Vous l'avez déjà essayé ? Soyez le premier à en parler aux autres !

Questions fréquentes

Fibonacci
Fair Value Gap
Key Levels
Order Block
Market Structure
Supply & Demand
Support & Resistance
Les produits disponibles sur cTrader Store, notamment les bots de trading, les indicateurs et les plug-ins, sont fournis par des développeurs tiers et mis à disposition à titre informatif et à des fins d'accès technique uniquement. cTrader Store n'est pas un courtier et ne fournit aucun conseil en investissement, aucune recommandation personnelle ni aucune garantie quant aux performances futures.

Plus de cet auteur

Indicateur
Fibonacci
Key Levels
+5
Displays the swing level zones shared by Flex Renko Inverse on any timeframe chart. Requires Flex Renko Inverse
Logo de "Flex Renko Inverse"
Les mieux notés
4.2
(4)
$99
Indicateur
Pin Bar
Order Block
+5
NEVER MISS A TREND & LET TRENDS RUN with Sierra Chart's Flex Renko Inverse, rebuilt for cTrader.

Vous pourriez aussi aimer

Indicateur
AI
SMC
+5
Coloring trendline/ Colored Trendline / Color Trendline
Indicateur
RSI
Fibonacci
+1
Spot RSI divergences on your chart and get an entry, stop and six targets when your filters line up.
Indicateur
SMC
Prop
+15
Automatic Elliott Wave Detection with Professional Filters
Indicateur
Support & Resistance
Detects Gartley, Bat, Butterfly, Crab, Shark & Cypher patterns and backtests each one's real win rate.
Logo de "ADT_bigCandles"
Les mieux notés
4.7
(4)
$20
/
$40
Indicateur
ATR
Prop
Outside Candle Detector: Highlights major candles/zones with ATR filter & pattern labels. By Avydel Talbo, prop trader.
Indicateur
AI
ATR
+26
Session Volume Profile + Composite. POC/VAH/VAL, Focus/Solo. Fast, clean, no ghosts, live-ready.
Indicateur
AI
SMC
+5
Complete ICT Killzones: 5 sessions, easy colors, transparency controls & session info. Professional timing for cTrader.
Indicateur
BOS
CHOCH
+5
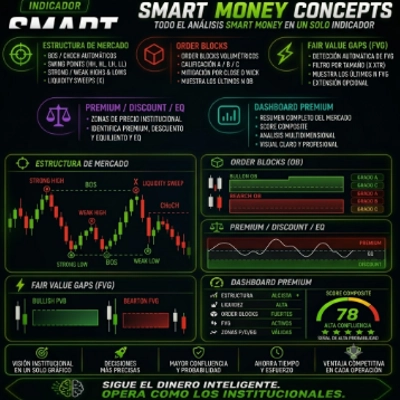
Smart Money Concepts Automate your institutional analysis and make decisions with pinpoint precision..
Indicateur
ATR
BOS
+5
Opening ranges, dynamic trend channels, and multi-scale breakout/retest analysis for clear intraday chart decisions.
Indicateur
VWAP
Volume
+5
Multi VWAP. Three timeframes. One clean chart. Your Essential Trading Tool.
Indicateur
ATR
BOS
+5
Market structure with BOS and CHoCH, order blocks, and retest buy/sell arrows with entry, stop and two targets
Indicateur
ATR
Forex
+6
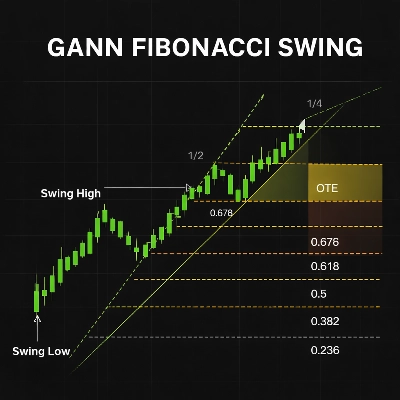
It combines swing (pivot-based) market structure detection with Gann Fan geometry and Fibonacci retracement/extension
Logo de "macdZR"
Les mieux notés
4.6
(5)
$19
Indicateur
MACD
Forex
+5
MACD ZERO LAG. Get faster signals, earlier trend detection, and eliminate the delay of traditional moving averages
Indicateur
SMC
Prop
+14
FVG Multi Time Frame Indicator
Indicateur
Forex
BTCUSD
+11
Visualize trends with Standard Deviation Channel! Display median, and add customizable upper/lower deviation channels.
Indicateur
ATR
MSS
+5
Advanced market structure and institutional cycle mapper with visual reference cards and entry alerts
Indicateur
RSI
XAUUSD
+2
Automatic ZigZag swings with dynamic support & resistance levels, labeling highs/lows for clear trend signals.
Indicateur
ATR
SMC
+5
Candles Volume Delta is a powerful, visually intuitive indicator that transforms raw tick volume into actionable trading

Prix

1
Installations gratuites