Deskripsi
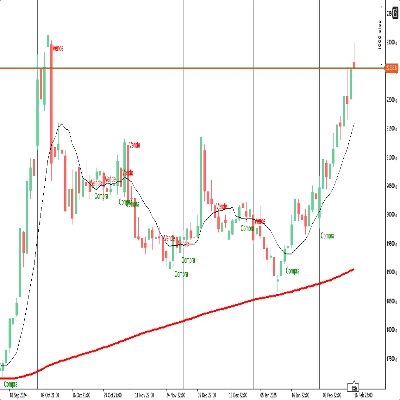
https://chartshots.spotware.com/c/695bff3f3bc21
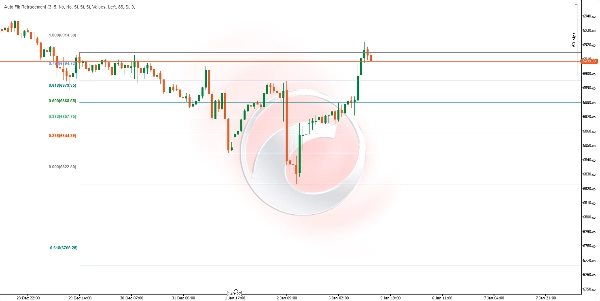
https://chartshots.spotware.com/c/695bffac03fb1
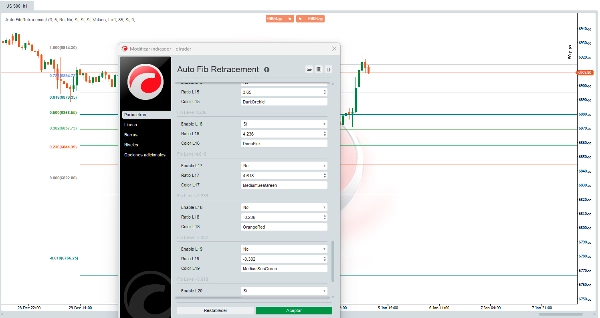
https://chartshots.spotware.com/c/695c0002aabb7
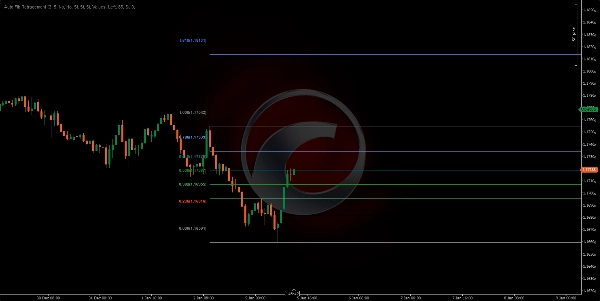
📊 Auto Fib Retracement
Auto Fib Retracement adalah indikator analisis teknikal yang secara otomatis menggambar level retracement dan ekstensi Fibonacci berdasarkan pergerakan harga signifikan terbaru. Berbeda dengan alat Fibonacci manual, indikator ini mendeteksi titik pivot pasar secara otomatis dan memperbarui level secara waktu nyata.
⚙️ Bagaimana Cara Kerjanya?
Deteksi Pivot Otomatis
Indikator menggunakan algoritma ZigZag dinamis untuk mengidentifikasi harga tertinggi dan terendah yang signifikan:
- Lookback (Kedalaman): Menentukan berapa banyak bar yang dianalisis ke belakang untuk mengonfirmasi titik pivot. Nilai yang lebih tinggi mendeteksi ayunan yang lebih besar; nilai yang lebih rendah lebih sensitif terhadap pergerakan yang lebih kecil.
- Sensitivitas (Deviasi): Mengontrol seberapa signifikan pergerakan harga harus untuk membentuk pivot baru. Ini dihitung dengan mengalikan ATR 10-periode (Average True Range) dengan faktor ini. Nilai yang lebih tinggi menyaring noise dan hanya mendeteksi pergerakan penting.
Perhitungan Level Fibonacci
Setelah dua pivot terbaru (tinggi dan rendah) diidentifikasi, indikator menghitung setiap level menggunakan rumus Fibonacci klasik:
Level = Harga Anchor + (Rentang Pergerakan × Rasio Fibonacci)
Dimana:
- Harga Anchor: Harga pivot terbaru (atau sebelumnya jika arah berbalik)
- Rentang Pergerakan: Perbedaan antara dua pivot
- Rasio yang Tersedia: 0, 0.236, 0.382, 0.5, 0.618, 0.65, 0.786, 1, 1.272, 1.414, 1.618, 1.65, 2.618, 2.65, 3.618, 3.65, 4.236, 4.618, dan level negatif (-0.236, -0.382, -0.618, -0.65)
📈 Untuk Apa Ini?
UseDescription
Mengidentifikasi Support & Resistance
Level 0.382, 0.5, dan 0.618 adalah zona klasik dimana harga cenderung bereaksi 🔵
Menentukan Target Harga
Level ekstensi (1.618, 2.618, 3.618, 4.236) membantu memproyeksikan seberapa jauh pergerakan mungkin terjadi 🎯
Merencanakan Entri
Cari pullback ke level kunci untuk masuk sesuai arah tren ⬆️⬇️
Menetapkan Stop-Loss
Tempatkan stop di luar level Fibonacci yang relevan 🛑
Mengonfirmasi Zona Pembalikan
Ketika harga mencapai level ekstensi ekstrem, ini dapat menunjukkan kelelahan 🔄
🛠️ Cara Menggunakannya
Parameter Utama
Deskripsi ParameterNilai yang Disarankan
Sensitivitas
Pengali deviasi untuk menyaring pergerakan kecil
3 (default)
Lookback
Jumlah minimum bar untuk menghitung pivot
10 (default)
Balik Arah
Membalik titik referensi untuk perhitungan level
Nonaktif
Opsi Tampilan
OpsiFungsi
Perpanjang Kiri / Kanan
Memperpanjang garis horizontal ke kiri atau kanan grafik
Tampilkan Harga
Menampilkan harga tepat dari setiap level
Tampilkan Rasio
Menampilkan rasio Fibonacci (nilai atau persentase)
Posisi Label
Menempatkan label ke kiri atau kanan
Opasitas Zona
Mengontrol transparansi zona berwarna antara level
Level Fibonacci yang Dapat Dikustomisasi
Setiap dari 22 level dapat:
- Diaktifkan atau dinonaktifkan secara individual
- Nilai numeriknya diubah
- Warnanya diubah
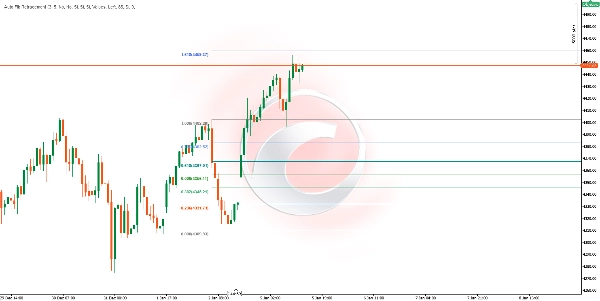
💡 Menafsirkan Zona
Zona berwarna antara level berturut-turut memudahkan identifikasi visual:
- Zona Hijau/Biru (0.382 - 0.786): Area pullback sehat dalam tren. Zona umum untuk mencari entri. ✅
- Zona Level 1.0: Mewakili 100% dari pergerakan sebelumnya. Bertindak sebagai support/resistance kunci. ⚖️
- Zona Merah/Merah Muda (1.618+): Ekstensi dari pergerakan. Harga yang mencapai zona ini dapat menunjukkan over-ekstensi. ⚠️
⚠️Pertimbangan
- Indikator memperbarui secara otomatis saat mendeteksi pivot signifikan baru
- Ini bekerja pada semua kerangka waktu dan aset keuangan
- Level Fibonacci adalah zona probabilitas, bukan jaminan
- Disarankan digunakan bersamaan dengan indikator lain atau analisis aksi harga
- Dalam pasar yang bergerak sideways atau bergejolak, pivot dapat berubah sering
📝 Catatan Teknis
- ATR 10-periode digunakan secara internal untuk menghitung ambang dinamis untuk deteksi pivot
- Indikator memerlukan data historis minimum setara dua kali parameter Lookback agar berfungsi dengan benar
- Garis dan zona hanya digambar ulang pada bar terakhir untuk mengoptimalkan kinerja 🚀
Ringkasan
The indicator helps traders identify potential support and resistance zones, define price targets, plan entries on pullbacks, set stop-losses beyond key levels, and confirm reversal zones when price reaches extreme extensions. It works on any timeframe and financial asset, including Forex, stocks, commodities, indices, and cryptocurrencies such as BTCUSD, EURUSD, GBPUSD, XAUUSD, NAS100, and others.
Users can customize parameters like sensitivity, lookback period, direction inversion, and display options (line extension, price and ratio labels, zone opacity, and colors). Colored zones visually highlight key Fibonacci areas for easier interpretation. The indicator updates automatically with new pivots and redraws levels on the latest bar to optimize performance.