Descripción
🚀Proyección de Precio Volumen de Oscilación: 📈
https://chartshots.spotware.com/c/6980f0f0287fb
La Proyección de Precio Volumen de Oscilación es una herramienta avanzada de pronóstico diseñada para trazar la ruta futura más probable de un activo basada en oscilaciones recientes de precio y ratios armónicos de Fibonacci. Identifica el rango actual del mercado y proyecta un "mapa de ruta" de múltiples etapas para la posible acción del precio.
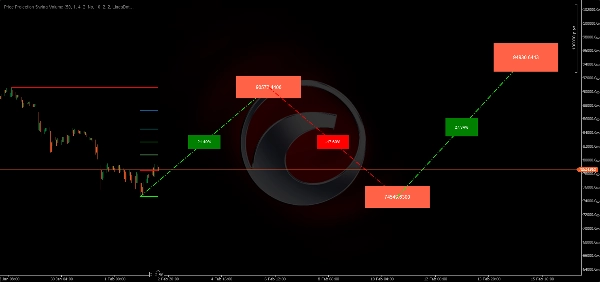
🔍 Análisis y Condiciones del Mercado
https://chartshots.spotware.com/c/6980f104dab21
Este algoritmo se centra en identificar la "Envolvente del Mercado" analizando:
- Puntos Extremos de Oscilación: Escanea un Periodo de Retroceso específico (por ejemplo, las últimas 50 barras) para encontrar el Máximo Máximo y Mínimo Mínimo absoluto.
- Zonas de Retroceso: Calcula y traza automáticamente cinco niveles clave de Fibonacci (23.6%, 38.2%, 50%, 61.8% y 78.6%) dentro de la oscilación actual para identificar áreas de interés.
- Proyecciones Armónicas: Usando el Ratio de Proyección (por defecto 0.618), el algoritmo calcula una ruta futura de tres segmentos basada en movimientos medidos desde el punto de oscilación más reciente.
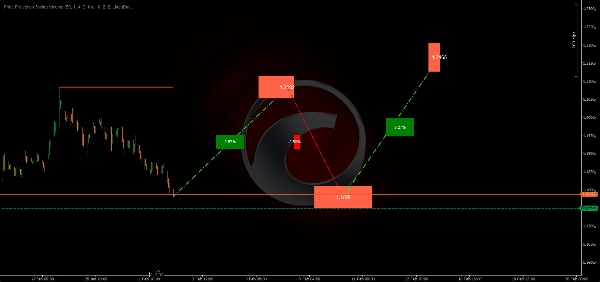
🟢 Cómo Interpretar Señales y Visuales
https://chartshots.spotware.com/c/6980f126d875a
- Líneas Horizontales de Oscilación: Las gruesas líneas Rojas (Alto) y Verdes (Bajo) representan los límites actuales del mercado. Que el precio rompa estas líneas suele señalar un cambio de tendencia.
- La Ruta de Proyección (Líneas Punteadas): Las líneas diagonales pronostican un movimiento "zigzag". Esta es la predicción del algoritmo sobre cómo podría moverse el precio para alcanzar su objetivo final.
- Etiquetas de Porcentaje: Ubicadas en las líneas diagonales, muestran la ganancia o pérdida % esperada para ese segmento específico del movimiento.
- Cajas de Precio Objetivo: Las cajas coloreadas al final de cada segmento proporcionan el nivel exacto de precio que el algoritmo está apuntando.
⚙️ Configuraciones y Parámetros Clave
- Periodo de Retroceso (50): Determina la escala de las oscilaciones. Un número mayor busca oscilaciones "Macro", mientras que un número menor se enfoca en oscilaciones "Micro" para scalping.
- Ratio de Proyección (0.618): Este "Ratio Dorado" determina la profundidad y altura de los zigzags proyectados. Puedes ajustarlo para objetivos más o menos agresivos.
- Personalización Visual: Colores totalmente ajustables para proyecciones Alcistas/Bajistas y niveles específicos de Fibonacci para que coincidan con el tema de tu gráfico.
🚀 Casos de Uso y Escenarios Típicos
- Establecimiento de Objetivos: Usa las cajas de precio proyectado para establecer niveles de Take Profit en operaciones de oscilación.
- Anticipación de Reversiones: Si la proyección muestra un retroceso profundo antes de un movimiento al alza, los traders pueden esperar a que el precio toque la línea punteada "valle" antes de entrar.
- Movimientos Medidos: Excelente para traders que siguen patrones "ABCD" o acción de precio armónica.
👤 Perfil del Trader Objetivo
- Traders de Oscilación y Tendencia: Ideal para quienes mantienen posiciones por varios días y necesitan un mapa de ruta de posibles resistencias.
- Traders Armónicos: Perfecto para usuarios que dependen de ratios de Fibonacci pero quieren que los cálculos se hagan automáticamente.
- Nivel de Experiencia: Intermedio. Los traders deben entender que estas son proyecciones y deben usarse junto con otras confirmaciones.
⚠️ Limitaciones Importantes y Notas de Uso
- Actualización Dinámica: Las proyecciones y niveles de oscilación "se desplazarán" en tiempo real si se crea un nuevo Máximo o Mínimo dentro de la ventana de retroceso.
- Inicialización: El indicador necesita una cantidad mínima de historial (igual al Periodo de Retroceso) antes de poder comenzar a trazar con precisión.
Resumen
The indicator visually displays horizontal swing boundary lines (red for highs, green for lows), dotted diagonal projection lines with percentage gain or loss labels, and target price boxes indicating exact projected price levels. These features help traders set take profit targets, anticipate retracements or reversals, and identify measured moves consistent with harmonic patterns.
Key customizable settings include the lookback period for swing scale, projection ratio for target aggressiveness, and visual color options for bullish/bearish projections and Fibonacci levels. The indicator updates dynamically as new highs or lows form within the lookback window and requires sufficient historical data to initialize.
Price Projection Swing Volume supports multiple markets including BTCUSD, EURUSD, GBPUSD, NZDUSD, XAUUSD, NAS100, and USDJPY, making it suitable for traders using Fibonacci-based harmonic strategies and swing trading approaches.