Deskripsi
🔷 Mesin Premium Garis Tren
Struktur Pasar Multi-Lapisan & Indikator Regresi Dinamis
https://chartshots.spotware.com/c/69d3c949a2e08
📌 Apa itu?
Mesin Premium Garis Tren adalah indikator overlay yang menggabungkan 5 modul independen menjadi satu alat. Setiap modul dapat diaktifkan atau dinonaktifkan. Ini memetakan struktur pasar, saluran dinamis, dan zona regresi berbasis volume langsung pada grafik harga.
Ini menjawab tiga pertanyaan inti:
- Di mana harga berada dalam struktur saat ini?
- Apa tren dominan dan di mana titik-titik terobosan?
- Pada level harga mana aktivitas terkonsentrasi?
🧩 5 Modul
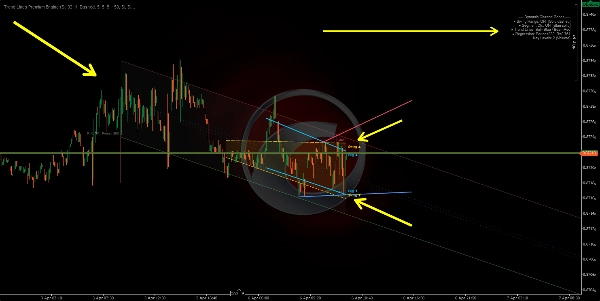
1️⃣ Penghubung Rentang Ayunan
https://chartshots.spotware.com/c/69d3cab9b805b
Mendeteksi titik ayunan tertinggi dan terendah terbaru, kemudian menggambar saluran miring yang menghubungkan yang tertua ke yang terbaru di kedua sisi. Area di antaranya diisi sebagai zona rentang dinamis.
Cara kerjanya:
- Sebuah bar memenuhi syarat sebagai titik ayunan ketika harga tertingginya (atau terendahnya) adalah yang paling ekstrem dibandingkan dengan N bar sebelum dan N bar setelahnya.
- Garis lurus digambar dari ayunan yang tersimpan tertua ke yang terbaru, menciptakan batas atas dan bawah.
- Saluran bergeser secara otomatis setiap kali titik ayunan baru dikonfirmasi.
Cara membacanya:
- Harga di dalam saluran → rentang struktural yang terdefinisi.
- Break di atas/bawah → ekspansi volatilitas atau pergeseran struktur.
- Kemiringan saluran → arah rentang yang dominan.
Parameter
Tujuan
Bar Sebelum / Sesudah Ayunan
Bar yang diperlukan di setiap sisi untuk mengonfirmasi ayunan. Semakin tinggi = ayunan lebih signifikan
Maks Titik Ayunan
Berapa banyak ayunan yang disimpan. Mengontrol kedalaman saluran
Jendela Riwayat
Seberapa jauh saluran digambar ke belakang
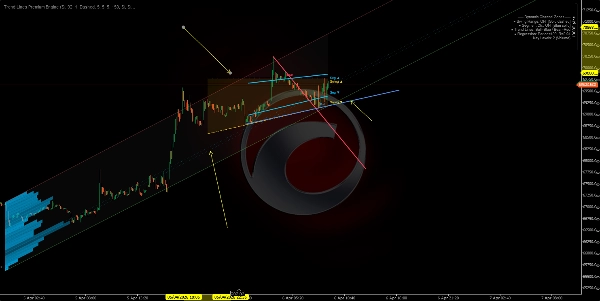
2️⃣ Saluran Linear Segmen
https://chartshots.spotware.com/c/69d3cb221bba1
Membagi jendela analisis menjadi 5 segmen sama, menemukan harga tertinggi dan terendah di masing-masing, kemudian memasang garis regresi kuadrat terkecil melalui 5 titik atas tersebut dan satu lagi melalui 5 titik bawah.
Cara kerjanya:
- Jendela dibagi menjadi 5 bagian. Satu ekstrem perwakilan diambil per bagian.
- Regresi linear diterapkan pada 5 titik tersebut untuk setiap batas.
- Hasilnya adalah saluran yang menyesuaikan dengan struktur harga yang tersegmentasi daripada hanya dua titik akhir.
Cara membacanya:
- Saluran naik → tren naik struktural.
- Saluran turun → tren turun struktural.
- Sentuhan berulang pada batas → dukungan/penolakan dinamis.
Perbedaan dari Modul 1: Penghubung Rentang Ayunan hanya menghubungkan ayunan pertama dan terakhir. Saluran Segmen menggunakan regresi 5 titik, membuatnya lebih halus dan kurang reaktif terhadap satu ayunan.
3️⃣ Label Titik Ayunan
Mendeteksi ayunan tinggi dan rendah dan mengklasifikasikannya ke dalam 4 kategori struktur pasar:
Label
Makna
Menunjukkan
HL
Higher Low (Rendah Lebih Tinggi)
Struktur bullish
HH
Higher High (Tinggi Lebih Tinggi)
Struktur bullish
LH
Lower High (Tinggi Lebih Rendah)
Struktur bearish
LL
Lower Low (Rendah Lebih Rendah)
Struktur bearish
Cara kerjanya:
- Setiap ayunan rendah baru dibandingkan dengan ayunan rendah sebelumnya. Lebih tinggi → HL. Lebih rendah → LL.
- Setiap ayunan tinggi baru dibandingkan dengan ayunan tinggi sebelumnya. Lebih tinggi → HH. Lebih rendah → LH.
Cara membacanya:
- HL + HH urutan → tren naik tetap utuh.
- LH + LL urutan → tren turun tetap utuh.
- HL yang menembus LL, atau LH yang menembus HH → pergeseran struktur (BOS/CHoCH).
Secara default hanya HL dan LH yang ditampilkan untuk menjaga grafik tetap bersih. HH dan LL dapat diaktifkan untuk visibilitas struktur penuh.
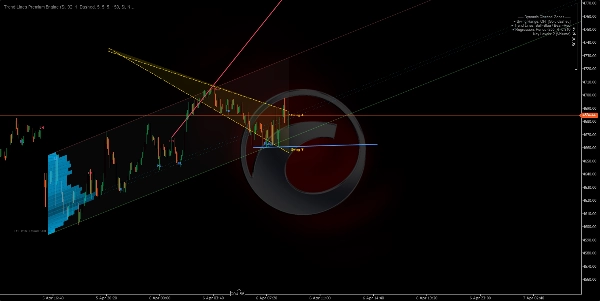
4️⃣ Garis Tren Otomatis
https://chartshots.spotware.com/c/69d3cc071272e
Menggambar garis tren yang menghubungkan dua ayunan rendah terbaru (garis bullish) dan dua ayunan tinggi terbaru (garis bearish). Garis aktif ditonjolkan; garis sebelumnya memudar.
Cara kerjanya:
- Ayunan rendah baru terdeteksi → garis digambar dari ayunan rendah sebelumnya ke yang baru (garis tren bullish).
- Ayunan tinggi baru terdeteksi → garis digambar dari ayunan tinggi sebelumnya ke yang baru (garis tren bearish).
- Garis diproyeksikan ke depan sebanyak sejumlah bar yang dapat dikonfigurasi.
- Ketika garis baru dibuat, garis sebelumnya memudar menjadi warna semi-transparan.
Sinyal breakout (opsional): Saat diaktifkan, indikator mendeteksi jika harga penutupan menembus garis tren aktif:
- 🔼 Panah ke atas → breakout bullish.
- 🔽 Panah ke bawah → breakout bearish.
Parameter
Tujuan
Maks Pasangan Garis
Berapa banyak pasangan garis yang tetap terlihat. Atur ke 1 untuk tampilan paling bersih
Maks Bar Perpanjangan
Seberapa jauh garis diproyeksikan ke depan. Mencegah garis melintasi seluruh grafik
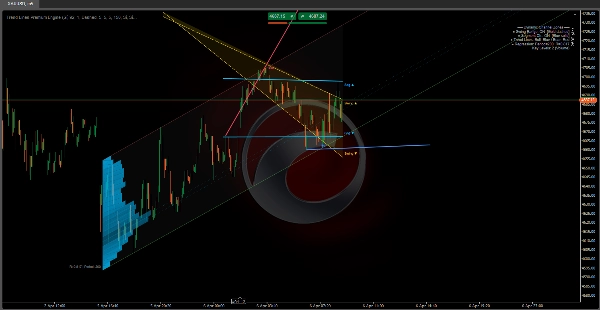
5️⃣ Zona Regresi Dinamis
Modul paling canggih. Menghitung saluran regresi linear pada harga penutupan dan menampilkan profil aktivitas (histogram) yang menunjukkan di mana volume atau sentuhan terkonsentrasi dalam saluran. Juga menandai level kunci di zona aktivitas tertinggi.
A) Saluran Regresi:
- Regresi linear kuadrat terkecil diterapkan pada harga penutupan selama periode tertentu.
- Deviasi standar harga dari garis regresi dihitung.
- Pita atas dan bawah ditempatkan pada N deviasi standar dari pusat (default: 2.0).
- Opsional dihitung dalam skala logaritmik untuk akurasi lebih baik pada instrumen harga tinggi atau volatilitas tinggi.
B) Deteksi Periode Otomatis:
- Algoritma menguji beberapa periode (50 hingga 400 bar) dan menghitung koefisien korelasi Pearson untuk masing-masing.
- Memilih periode dengan korelasi tertinggi — di mana regresi linear paling sesuai dengan pergerakan harga.
- Nilai korelasi ditampilkan pada grafik (misalnya, R = 0.85).
C) Histogram Aktivitas:
- Saluran dibagi menjadi bagian horizontal (hingga 25).
- Untuk setiap bagian, algoritma menghitung berapa banyak bar yang menyentuh level harga tersebut, diberi bobot oleh volume atau jumlah sentuhan (dapat dikonfigurasi).
- Bagian dengan aktivitas lebih tinggi muncul sebagai bar yang lebih panjang dan lebih pekat.
- Ini mengungkapkan Titik Kontrol (POC) dan zona aktivitas tinggi/rendah dalam saluran.
D) Level Kunci:
- Bagian dengan aktivitas tertinggi diproyeksikan ke depan sebagai garis horizontal.
- Mereka berfungsi sebagai dukungan dan resistensi berbasis volume dalam konteks regresi.
Cara membacanya:
- Harga dekat pita atas → zona jenuh beli secara statistik.
- Harga dekat pita bawah → zona jenuh jual secara statistik.
- R mendekati 1 atau -1 → tren linear yang kuat dan dapat diandalkan. R mendekati 0 → pasar bergerak sideways atau regresi tidak signifikan.
- Level kunci berfungsi sebagai magnet harga — zona dengan konsentrasi aktivitas historis cenderung menarik harga kembali.
🎯 Kasus Penggunaan
Kasus Penggunaan
Modul
Mengidentifikasi struktur pasar (bullish/bearish/range)
Label Ayunan + Garis Tren
Mendeteksi dukungan & resistensi dinamis
Rentang Ayunan + Saluran Segmen
Menemukan zona nilai berdasarkan volume
Zona Regresi + Level Kunci
Mengonfirmasi terobosan struktur
Garis Tren + Sinyal Breakout
Mengukur kekuatan tren
Korelasi Pearson (Zona Regresi)
⚙️ Pengaturan yang Direkomendasikan berdasarkan Gaya
Gaya
Modul yang Disarankan
Scalping (M1–M15)
Label Ayunan + Garis Tren
Intraday (M15–H1)
Semua modul
Swing Trading (H4–D1)
Rentang Ayunan + Zona Regresi + Level Kunci
Analisis struktur murni
Hanya Label Ayunan + Garis Tren
⚠️ Catatan Penting
Ringkasan
The five modules include:
1. Swing Range Connector: Detects recent swing highs and lows to draw a sloped channel representing the structural range.
2. Segment Linear Channel: Divides the analysis window into five segments, fitting regression lines through highs and lows for a smoother channel.
3. Swing Point Labels: Classifies swing highs and lows into four market structure categories (Higher High, Higher Low, Lower High, Lower Low) to indicate bullish or bearish trends and structure shifts.
4. Automatic Trend Lines: Connects the two most recent swing highs and lows with trend lines, highlighting active lines and optionally signaling breakouts.
5. Dynamic Regression Zone: Calculates a linear regression channel on closing prices with an activity histogram showing volume or touch concentration, marking key volume-based support and resistance levels.
The indicator supports various trading styles, recommending specific module combinations for scalping, intraday, swing trading, and pure structure analysis. It requires price bars and volume data and provides visualizations and signals including breakout, trend strength, and level touches or breaks.