
ms_Candle_ColseTime
Indicatore
496 download
Versione 1.0, Oct 2025
Windows, Mac
Descrizione
Prezzo: Gratis
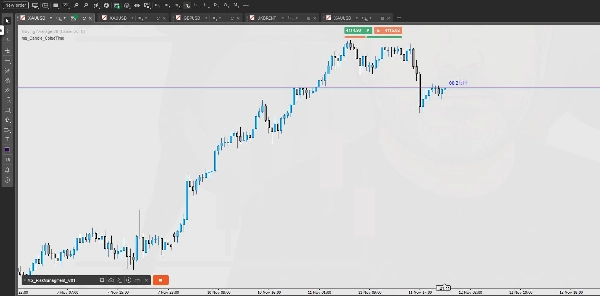
Non perdere mai più il conto del tempo della tua candela!
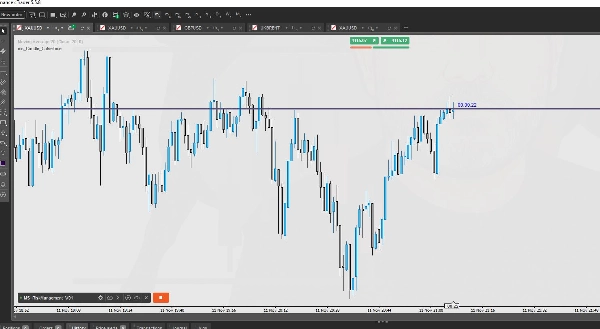
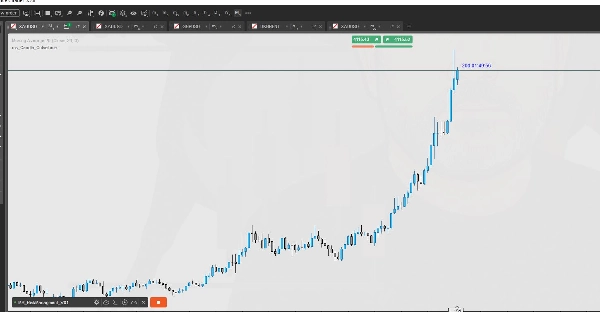
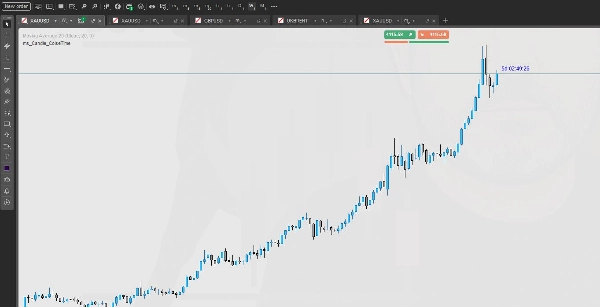
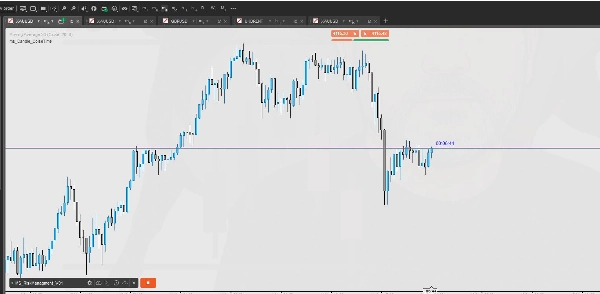
L'Indicatore Tempo Rimanente Candela mostra il tempo esatto rimanente fino alla chiusura della candela corrente — su tutti i timeframe e qualsiasi strumento — aggiornandosi dinamicamente mentre il mercato si muove.
💡 Caratteristiche Principali
- Supporto Multi-Timeframe — Funziona perfettamente su tutti i timeframe (da grafici da 1 minuto a 1 mese).
- Conto alla Rovescia in Tempo Reale — Si aggiorna continuamente ad ogni tick, perfettamente sincronizzato con l’orologio di mercato.
- Visualizzazione Fluttuante — Il timer si muove dinamicamente insieme al prezzo di mercato in tempo reale, rimanendo visibile dove serve di più.
- Interfaccia Compatta e Chiara — Tipografia pulita e posizionamento auto-regolato per la massima leggibilità.
- Posizionamento Personalizzabile — Puoi scegliere facilmente dove visualizzare il conto alla rovescia (es. vicino al prezzo, in alto a destra, in basso a sinistra).
- Leggero e Veloce — Consumo minimo di CPU; ideale per trader che usano più grafici o indicatori.
⚙️ Come Funziona
- L’indicatore rileva automaticamente il timeframe corrente del tuo grafico e l’ora del server.
- Calcola il tempo esatto rimanente fino alla chiusura della candela corrente.
- Si aggiorna in tempo reale — anche quando il mercato si muove tick dopo tick.
🧭 Perché i Trader lo Amano
- Perfetto per scalper e trader intraday che aspettano la chiusura delle candele prima di entrare.
- Ti mantiene consapevole del timing per breakout, conferme, e segnali di chiusura barra.
- Nessun ritardo, nessun refresh — pura precisione in tempo reale.
⚠️ Compatibilità
- Piattaforma: cTrader Desktop
- Funziona su: Tutti i simboli e timeframe
- Uso consigliato: Qualsiasi stile di trading — Scalping, Day Trading, Swing Trading
Come Usare l’Indicatore Tempo Rimanente Candela
Questo indicatore non richiede alcuna configurazione speciale.
Basta applicarlo al tuo grafico, e mostrerà automaticamente il tempo rimanente della candela corrente in base al timeframe selezionato.
Funziona su tutti i timeframe.
Riepilogo
Riepilogo AI
The ms_Candle_ColseTime indicator for cTrader Desktop provides a real-time countdown of the remaining time until the current candle closes on any chart. It automatically detects the chart’s timeframe and server time, then continuously updates the exact time left until candle closure with each market tick. This indicator supports all timeframes, from 1-minute to monthly charts, and works on all trading instruments available on the platform.
Key features include a floating display that moves dynamically with the live market price, customizable positioning options (e.g., near price, top-right, bottom-left), and a compact, clear user interface designed for readability. It is lightweight and optimized for minimal CPU usage, making it suitable for traders running multiple charts or indicators simultaneously.
This tool is particularly useful for scalpers and intraday traders who rely on precise candle close timing for entries, breakouts, confirmations, and bar close signals. It requires no special configuration—simply attach it to a chart to start viewing the countdown. The indicator supports all trading styles including scalping, day trading, and swing trading.
Profilo indicatore
Recensioni dei clienti
0.0
Recensioni: 0
Recensioni dei clienti
Questo prodotto non ha ancora ricevuto recensioni. L'hai già provato? Fallo sapere agli altri per primo!
Discussioni
Domande frequenti
Forex
I prodotti disponibili tramite cTrader Store, inclusi bot di trading, indicatori e plugin, sono forniti da sviluppatori terzi e resi disponibili esclusivamente a scopo informativo e di accesso tecnico. cTrader Store non è un broker e non fornisce consulenze in materia di investimento, raccomandazioni individualizzate o garanzie di risultati futuri.
Altro da questo autore


Prezzo
20.18M
Volume negoziato
105.55K
Profitto in pip
978
Installazioni gratuite