คำอธิบาย
📊 Trading Pro Market
https://chartshots.spotware.com/c/69f0ec41d4cfc
ช่องแนวโน้ม + การคาดการณ์ราคา + โซนแนวรับ & แนวต้านอัตโนมัติ — ทั้งหมดในตัวบ่งชี้แบบโอเวอร์เลย์เดียว
🔍 มันคืออะไร?
https://chartshots.spotware.com/c/69f0ec1fa9930
Trading Pro Market เป็นตัวบ่งชี้วิเคราะห์ทางเทคนิคขั้นสูงที่รวมสามเครื่องยนต์อิสระเข้าด้วยกันเป็นเครื่องมือเดียว: ช่องแนวโน้มพร้อมการฉายภาพล่วงหน้า, ระบบคาดการณ์ราคาที่อิงจากรูปแบบการเคลื่อนไหวในอดีต, และตัวตรวจจับโซนแนวรับ & แนวต้านอัตโนมัติ ทุกอย่างแสดงผลโดยตรงบนแผนภูมิราคา — ไม่ต้องใช้แผงแยก
📐 โมดูล 1 →ช่อง ICP🔮 โมดูล 2 → การคาดการณ์ MFP 🧲 โมดูล 3 → โซน S/R
https://chartshots.spotware.com/c/69f0ec8faa957
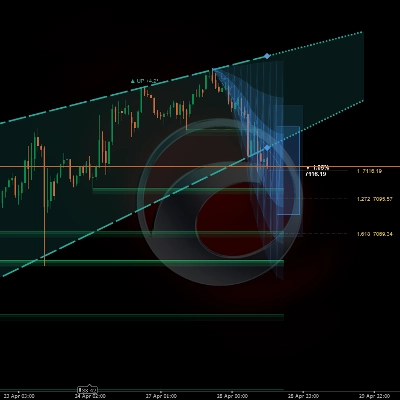
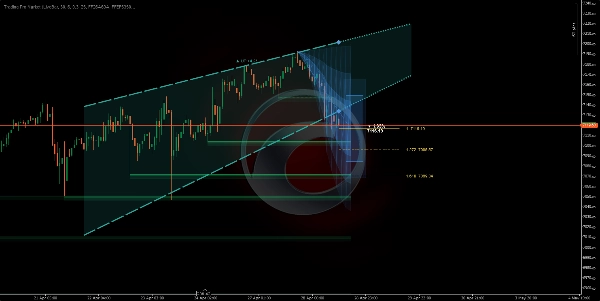
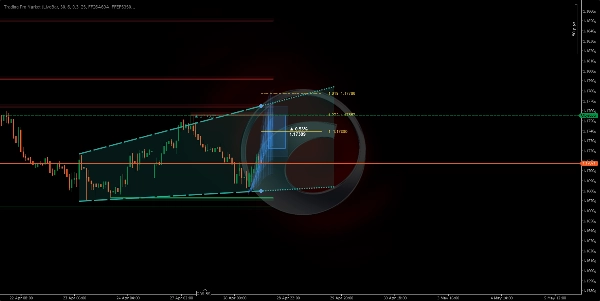
📐 โมดูล 1 — ช่องแนวโน้ม (ICP)
⚙️ มันตรวจจับแนวโน้มอย่างไร?
ตัวบ่งชี้จะแบ่งแท่งที่มองเห็นได้ออกเป็นบล็อกเวลา (ค่าเริ่มต้น: 30 แท่งต่อบล็อก, รวม 6 บล็อก) ภายในแต่ละบล็อกจะคำนวณจุดกึ่งกลางเชิงเรขาคณิตระหว่างราคาสูงสุดและต่ำสุดโดยใช้สเกลราคาลอการิทึม จากนั้นเชื่อมจุดกึ่งกลางเหล่านั้นข้ามบล็อกเพื่อกำหนดว่าราคากำลังมีแนวโน้มขึ้น ลง หรือเคลื่อนไหวด้านข้าง
ความชันของเส้นเชื่อมนี้จะถูกแปลงเป็นมุมที่แสดงเป็นองศา หากมุมต่ำกว่าค่าที่ตั้งไว้ (ค่าเริ่มต้น 0.3°) ตลาดจะถูกจัดประเภทว่าเป็นช่วงเคลื่อนไหวด้านข้าง หากสูงกว่าค่าดังกล่าว ตัวบ่งชี้จะกำหนดทิศทางเป็นขาขึ้นหรือขาลง
💡 ความผันผวนถูกวัดโดยใช้ตัวประมาณ Yang-Zhang — สูตรทางสถิติที่ใช้ราคาปิด เปิด สูง และต่ำเพื่อคำนวณความผันผวนที่แท้จริงของตลาด ตัวเลขนี้ช่วยปรับมุมให้เป็นมาตรฐานเพื่อให้ช่องทำงานได้อย่างสม่ำเสมอในสินทรัพย์หรือกรอบเวลาต่างๆ
🎨 มันวาดอะไรบนแผนภูมิ?
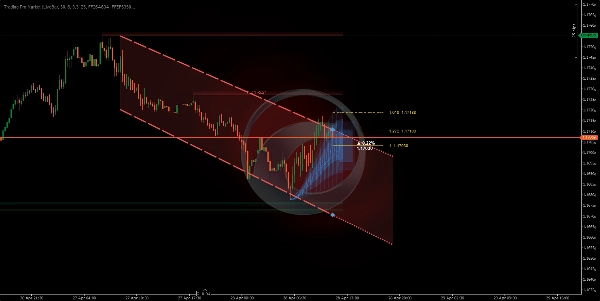
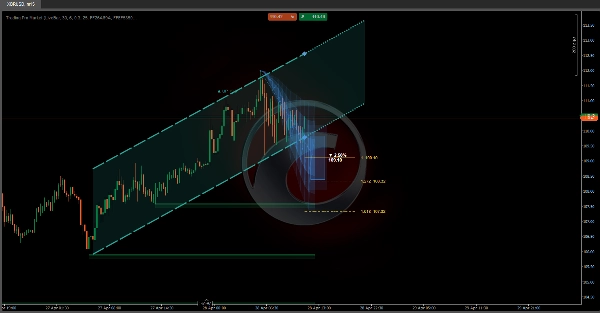
มันวาดเส้นสองเส้นที่สร้างช่อง (เพดานและพื้น) พร้อมโซนที่มีการไล่ระดับสีระหว่างเส้นเหล่านั้น ทางขวาของช่องจะขยายออกเป็นเส้นประตามความชันปัจจุบัน สีจะเปลี่ยนโดยอัตโนมัติตามทิศทาง:
🟢 สีเขียว — แนวโน้มขาขึ้น🔴 สีแดง — แนวโน้มขาลง⬜ สีเทา — ตลาดเคลื่อนไหวด้านข้าง
🔁 เครื่องสถานะ — ราคาตั้งอยู่ที่ใดภายในช่อง?
ตัวบ่งชี้ติดตามตำแหน่งราคาปิดแบบเรียลไทม์เทียบกับขอบเขตของช่องและจัดประเภทสถานการณ์เป็นห้าสถานะที่แตกต่างกัน:
🟦 ภายใน→⚡ เบรกเอาต์→📏 ระยะห่าง→↩️ ทดสอบซ้ำ→✅ ยืนยัน
แต่ละสถานะจะถูกอธิบายด้วยข้อความธรรมดาบนแผงข้อมูลของแผนภูมิ พร้อมกับระยะห่างเป็นเปอร์เซ็นต์ถึงเพดานหรือพื้นของช่องในแต่ละช่วงเวลา
🔮 โมดูล 2 — การคาดการณ์การเคลื่อนไหว (MFP)
⚙️ มันสร้างการคาดการณ์อย่างไร?
เครื่องยนต์ตรวจจับจุดเปลี่ยนราคาที่สำคัญ (จุดสูงและต่ำในท้องถิ่น) โดยดูย้อนหลังจำนวนแท่งที่ตั้งค่าได้ แต่ละจุดเปลี่ยนที่ยืนยันแล้วจะบันทึกข้อมูลสองจุด: เปอร์เซ็นต์ของการเคลื่อนไหวราคาที่เสร็จสมบูรณ์และจำนวนแท่งที่ใช้ เก็บการเคลื่อนไหวในอดีตได้สูงสุด 20 ครั้ง และคำนวณการเคลื่อนไหวถัดไปที่คาดหวังโดยใช้หนึ่งในสามวิธี:
⚖️ ถ่วงน้ำหนัก — การเคลื่อนไหวล่าสุดมีน้ำหนักมากกว่า➕ ค่าเฉลี่ยง่าย — ทุกการเคลื่อนไหวมีน้ำหนักเท่ากัน📊 มัธยฐาน — กรองค่าผิดปกติออก
🎨 มันวาดอะไรบนแผนภูมิ?
สามองค์ประกอบภาพที่เลือกได้จะถูกฉายไปข้างหน้าตามจุดเริ่มต้นของจุดเปลี่ยนปัจจุบัน:
1
🔵 โซนฉายภาพ: สามชั้นที่มีความทึบแสงลดลงซึ่งแสดงช่วงที่น่าจะเป็นไปได้ของการเคลื่อนไหว กรวยที่กว้างขึ้นหมายถึงความไม่แน่นอนที่มากขึ้นตามความแปรปรวนในอดีต
2
🎯 กล่องเป้าหมาย: สี่เหลี่ยมผืนผ้าที่วางไว้ที่ราคาปลายทางที่ประมาณไว้ พร้อมกับเปอร์เซ็นต์การเคลื่อนไหวที่คาดหวังและระดับราคาที่ระบุอย่างชัดเจนในข้อความ
3
📏 ระดับฟีโบนัชชี: เส้นแนวนอนที่ฉายจากจุดเริ่มต้นไปยังปลายทางโดยใช้สัดส่วนที่ตั้งค่าได้ (ค่าเริ่มต้น: 1.0, 1.272, และ 1.618).
⚠️ การคาดการณ์ไม่ได้ทำนายอนาคต มันเป็นค่าเฉลี่ยทางสถิติของการเคลื่อนไหวที่คล้ายกันในอดีต คุณค่าของมันอยู่ที่การตั้งความคาดหวังที่สมจริงสำหรับขนาดและระยะเวลา — ไม่ใช่สัญญาณเข้าออกแบบอิสระ
🧲 โมดูล 3 — โซนแนวรับ & แนวต้าน
⚙️ มันตรวจจับโซนอย่างไร?
ทุกครั้งที่จุดเปลี่ยนได้รับการยืนยัน ตัวบ่งชี้จะวาดโซนแนวนอนโดยใช้ ATR (ช่วงจริงเฉลี่ย) เพื่อกำหนดความหนาของโซน โซนแนวต้านจะวาดด้วยสีแดง โซนแนวรับด้วยสีเขียว — ทั้งสองมีสองชั้นความทึบแสงเพื่อสร้างความลึกและความชัดเจนทางสายตา
โซนทำงานแบบไดนามิก: หากราคาปิดอยู่ฝั่งตรงข้ามของโซน จะถูกทำเครื่องหมายว่า "ถูกทำลาย" — เปลี่ยนเป็นเส้นประที่มีความทึบแสงลดลง โซนจะหายไปโดยอัตโนมัติหลังจากจำนวนแท่งที่ตั้งค่าใน "อายุโซน"
🚀 วิธีใช้
1
ยืนยันแนวโน้ม: ตรวจสอบสีและทิศทางของช่อง มุมองศาบอกความแรงของแนวโน้ม — มุมที่ชันกว่าหมายถึงโมเมนตัมที่มากขึ้น
2
อ่านสถานะราคา: แผงข้อมูลบนแผนภูมิอธิบายว่าราคาอยู่ภายใน กำลังเบรกเอาต์ หรือทดสอบซ้ำขอบเขตของช่องแบบเรียลไทม์
3
ประเมินการฉายภาพ: กรวยและกล่องเป้าหมายให้ข้อมูลอ้างอิงว่าราคาอาจเคลื่อนไปที่ไหนและไกลแค่ไหน โดยอิงจากห้องสมุดรูปแบบในอดีตที่สร้างขึ้นในช่วงเซสชัน
4
เคารพโซน: กล่อง S/R ที่ไม่ถูกทำลายแสดงระดับราคาที่ตลาดเคยตอบสนอง โซนที่ยังไม่ถูกเจาะมีความสำคัญมากกว่าโซนที่ถูกเจาะแล้ว
🖥️ ความเข้ากันได้ & ข้อกำหนด
✅ cTrader✅ cAlgo API✅ สินทรัพย์ใดก็ได้✅ กรอบเวลาใดก็ได้✅ โอเวอร์เลย์ราคา
ไม่ต้องการการเข้าถึงอินเทอร์เน็ตหรือสิทธิพิเศษพิเศษ การคำนวณทั้งหมดทำในเครื่องโดยใช้ข้อมูลราคาที่มีอยู่ในแพลตฟอร์มแล้ว
⏱️ เพื่อผลลัพธ์ที่ดีที่สุด ใช้กับกรอบเวลาตั้งแต่ 15 นาทีขึ้นไป ในกรอบเวลาต่ำมาก (1–5 นาที) เสียงรบกวนของตลาดอาจสร้างจุดเปลี่ยนที่มีความน่าเชื่อถือต่ำ ลดคุณภาพของทั้งโซน S/R และการคาดการณ์
สรุป
รีวิวจากลูกค้า
5 | 0 % | |
4 | 100 % | |
3 | 0 % | |
2 | 0 % | |
1 | 0 % |


!["Gaussian Channel [Iridio Capital]" โลโก้](https://cdn.ctrader.com/image/webp/7c039209-5573-4a54-a072-f9528b503103_41960)