Descripción
Identificar zonas de ALTO INTERÉS INSTITUCIONAL: Donde hay MÁS VOLUMEN en las rupturas, hay MAYOR PARTICIPACIÓN de GRANDES JUGADORES.
• ⚖️ Medir el EQUILIBRIO DE PODER: Ver si LA PRESIÓN DE COMPRA o VENTA domina en cada zona de precio
• 🎯 Detectar NIVELES CLAVE: Zonas con MAYOR VOLUMEN DE RUPTURA a menudo actúan como SOPORTE/RESISTENCIA FUTUROS
• ✅ Confirmar movimientos: Una RUPTURA con ALTO VOLUMEN tiene una MAYOR PROBABILIDAD de ser genuina
https://chartshots.spotware.com/c/6941a3f65f376
📈 ¿CÓMO LEERLO?
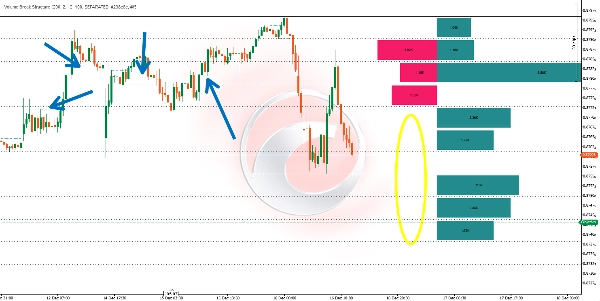
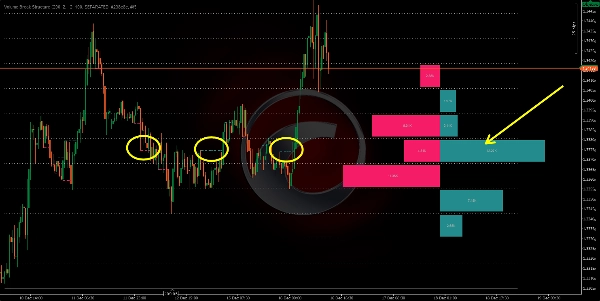
📊 Las Líneas Horizontales
• Cada línea marca un nivel donde ocurrió una RUPTURA DE ESTRUCTURA
• 🟢 rupturas ALCISTAS
• 🔴 rupturas BAJISTAS
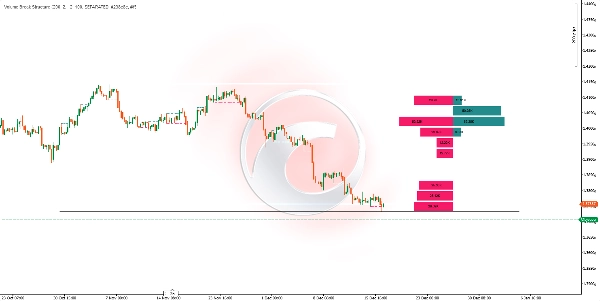
📈 El Histograma
• Ubicado en el LADO DERECHO DEL GRÁFICO
• Dividido en FILAS que representan RANGOS DE PRECIO IGUALES
• 📗 barras de PRESIÓN DE COMPRA: VOLUMEN ACUMULADO de rupturas alcistas en esa zona
• 📕 barras de PRESIÓN DE VENTA: VOLUMEN ACUMULADO de rupturas bajistas en esa zona
• ⬆️ Tamaño de barra: Un tamaño MÁS GRANDE indica MAYOR VOLUMEN de rupturas en ese nivel
https://chartshots.spotware.com/c/6941a4346ede0
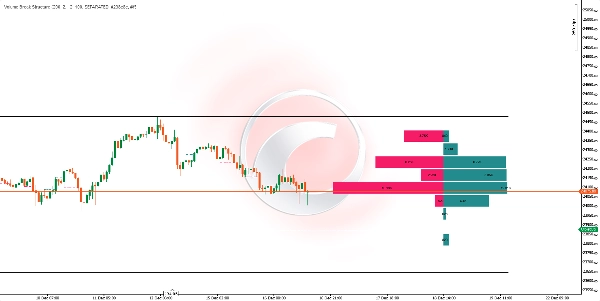
🟦 La Cuadrícula
• Las líneas SÓLIDAS superior e inferior marcan el RANGO MÁXIMO y MÍNIMO del período analizado
• Las líneas PUNTEADAS dividen ese rango en SECCIONES IGUALES para facilitar la lectura
⚙️ 🔧 PARÁMETROS PRINCIPALES
ParámetroFunción
🕯️ Barras de Cálculo
Número de velas que analiza HACIA ATRÁS
🎚️ Longitud del Swing
SENSIBILIDAD para detectar pivotes (MAYOR = menos señales, MÁS CONFIABLE)
📊 Filas del Histograma
Número de DIVISIONES/FILAS en el histograma
📏 Ancho del Histograma
ANCHO VISUAL del histograma
👁️ Modo de Visualización
SEPARADO (compra/venta) o AGREGADO (volumen total)
🔄 ¿CUÁNDO SE ACTUALIZA?
🕒 El indicador SE RECALCULA AUTOMÁTICAMENTE al CERRAR cada vela, incorporando cualquier NUEVA RUPTURA DE ESTRUCTURA que haya ocurrido.
💡 🤝 ¿CÓMO COMBINARLO?
📈 Con ANÁLISIS DE TENDENCIA
• En una TENDENCIA ALCISTA, buscar zonas donde DOMINE EL VOLUMEN DE PRESIÓN DE COMPRA para posibles entradas en RETROCESOS
• En una TENDENCIA BAJISTA, buscar zonas donde DOMINE EL VOLUMEN DE PRESIÓN DE VENTA para posibles entradas en REBOTES
🛡️ Con SOPORTE y RESISTENCIA
• Los niveles con el MAYOR VOLUMEN DE RUPTURA a menudo se convierten en ZONAS DE REACCIÓN FUTURAS
• Usar el histograma para identificar las zonas más "DEFENDIDAS" por compradores o vendedores
🌊 Con FLUJO DE ÓRDENES
• CONFIRMAR las lecturas del histograma con herramientas de FLUJO DE ÓRDENES EN TIEMPO REAL
• Las zonas de alto volumen de ruptura a menudo coinciden con ÁREAS DE ABSORCIÓN INSTITUCIONAL
🕯️ Con ACCIÓN DEL PRECIO
• Buscar PATRONES DE VELAS en zonas donde el histograma muestra UN DESEQUILIBRIO SIGNIFICATIVO
• Un PATRÓN DE REVERSIÓN en una zona de ALTA PRESIÓN DE COMPRA tiene una MAYOR PROBABILIDAD DE ÉXITO
🎯 🚀 INTERPRETACIÓN RÁPIDA
Señal VisualInterpretación
📗 Barra GRANDE de COMPRADOR, 📕 barra pequeña de vendedor
ZONA DE DEMANDA FUERTE, posible SOPORTE
📕 Barra GRANDE de VENDEDOR, 📗 barra pequeña de comprador
ZONA DE OFERTA FUERTE, posible RESISTENCIA
⚔️ Ambas barras GRANDES y similares
ZONA DE BATALLA, ALTA VOLATILIDAD esperada
⏭️ Fila sin BARRAS
ZONA DE POCO INTERÉS, el precio pasó RÁPIDAMENTE
CONSIDERACIONES IMPORTANTES
• ❌ El indicador FUNCIONA CON DATOS HISTÓRICOS CONFIRMADOS; NO PREDICE EL FUTURO
• 📊 MAYOR número de barras de cálculo = VISIÓN MÁS AMPLIA pero puede DILUIR LAS SEÑALES RECIENTES
• ⏰ AJUSTAR la Longitud del Swing según el MARCO TEMPORAL: VALORES MÁS ALTOS para MARCOS TEMPORALES MÁS ALTOS
• 🛡️ SIEMPRE COMBINAR con UNA GESTIÓN DE RIESGO ADECUADA
Resumen
Key features include:
- Horizontal lines marking bullish (green) and bearish (red) structure breaks.
- A histogram on the right side of the chart divided into rows representing equal price ranges, showing accumulated volume of bullish and bearish breaks. Larger bars indicate higher volume.
- A grid marking the maximum and minimum price range of the analyzed period, divided into equal sections for easier reading.
The indicator recalculates automatically at the close of each candle, updating with any new structure breaks. Main adjustable parameters include the number of bars analyzed backward, swing length sensitivity for pivot detection, histogram rows, histogram width, and display mode (separated buy/sell or aggregated volume).
Volume Break Structure can be combined with trend analysis, support and resistance levels, order flow tools, and price action patterns to confirm market movements and identify potential entry points. It works with confirmed historical data and does not predict future price action.
Valoraciones de clientes
5 | 0 % | |
4 | 100 % | |
3 | 0 % | |
2 | 0 % | |
1 | 0 % |