Descrição
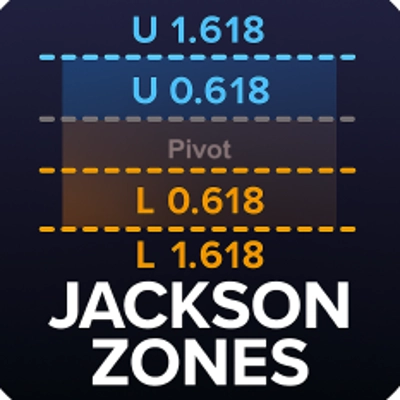
📊 Jackson Zones — Mapeamento Adaptativo de Zonas de Fibonacci
Revele o ritmo por trás da ação do preço. Jackson Zones mapeia a estrutura intradiária e multidiária usando intervalos de sessão projetados por Fibonacci, rotulagem adaptativa e lógica de tempo robusta. Projetado para clareza de nível institucional, é sua vantagem em mercados voláteis.
🔍 Principais Características
- Multiplicadores de Fibonacci Personalizáveis
Defina suas próprias razões de expansão (padrão: 0.618, 1.000, 1.618) para adaptar as zonas à sua estratégia.
- Modo Multidiário: Ative para estender as zonas por várias sessões, revelando estrutura persistente e confluência de longo alcance.
- Lógica de Final de Semana
Usa automaticamente os dados de sexta-feira para as sessões de domingo e segunda-feira, garantindo níveis confiáveis mesmo em corretores com barras de domingo.
- Flexibilidade Visual
- Cores ajustáveis para zonas superior/inferior
- Controle de opacidade (0–255) para sobreposições transparentes
- Rótulos opcionais que refletem dinamicamente seus multiplicadores escolhidos
- Design de Sobreposição
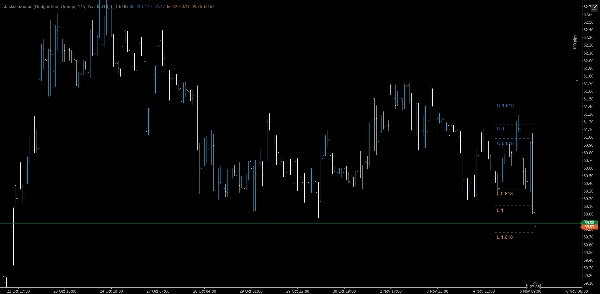
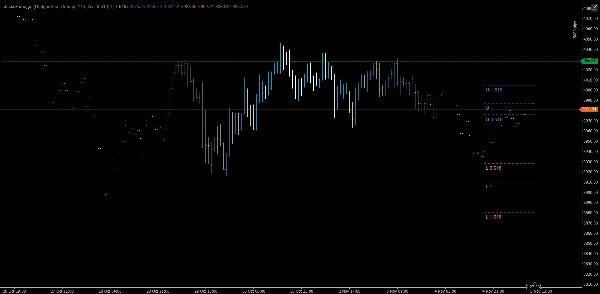
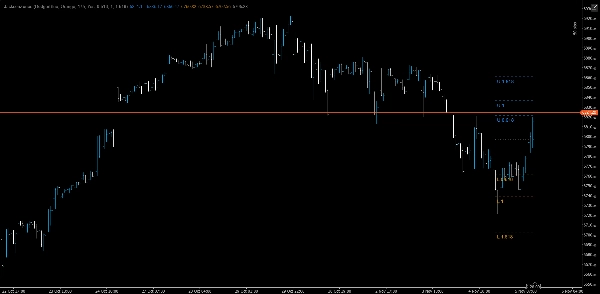
Zonas e pivôs são plotados diretamente no gráfico de preços para contexto imediato.
🧠 Casos de Uso
• Confirmação de Rompimento: Movimentos fortes através das zonas 1.000 ou 1.618 frequentemente sinalizam continuação.
• Detecção de Reversão: Falhas nas zonas 0.618 ou 1.000 indicam exaustão.
• Gestão de Trade: Use as zonas para posicionamento de stop, escalonamento ou metas de lucro.
• Ancoragem de Sessão: Zonas são reiniciadas diariamente, adaptando-se à volatilidade em evolução enquanto respeitam os gaps de final de semana.
Resumo
Avaliações de clientes
5 | 0 % | |
4 | 100 % | |
3 | 0 % | |
2 | 0 % | |
1 | 0 % |


![Logótipo de "[Hamster-Coder] Moving Average MTF"](https://cdn.ctrader.com/image/webp/b11b98b1-194d-4b8e-b00e-d611826ad159_31226)


