
Açıklama
Döviz Sepeti - Özel Bileşik Endeks Göstergesi
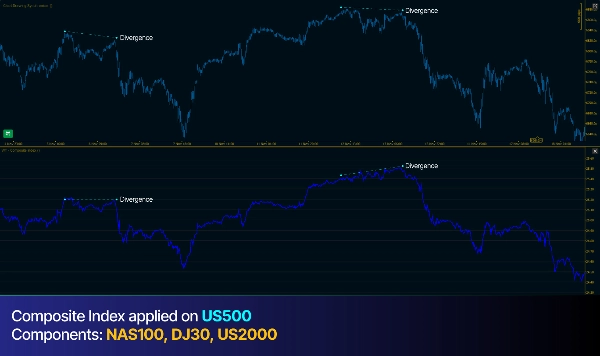
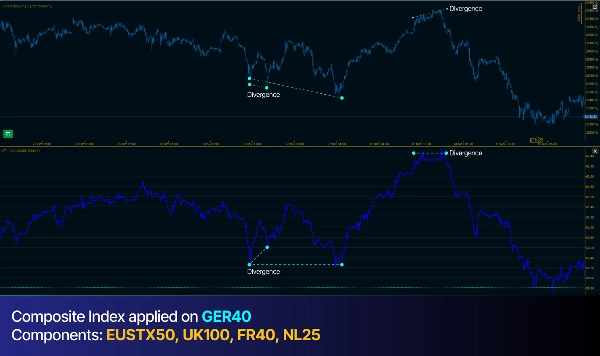
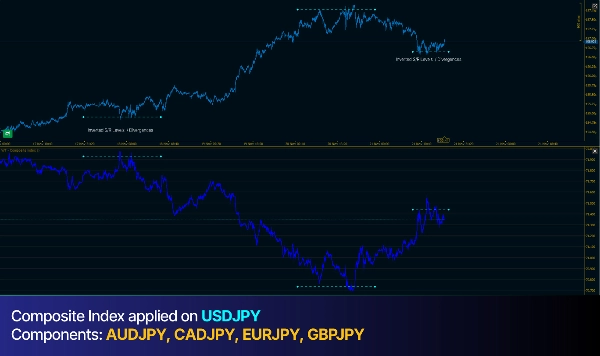
Bu gösterge, birden fazla döviz çiftini tek bir bileşik güç endeksinde birleştirir ve grafik altındaki ayrı bir panelde gösterir. Hem fiyat grafiğinizde hem de sepet endeksinde pivot noktalarını (fraktalleri) otomatik olarak algılar ve ardından bunları trend çizgileriyle bağlayarak uyumsuzlukları ortaya çıkarır.
Sürüm 2.0 - Sürüm Notları Sekmesine Bakınız
Gelecek güncellemeler için açık
-------------------------------------------------------------------------------------------------------------------------------------------------------
Ne Yapar
-------------------------------------------------------------------------------------------------------------------------------------------------------
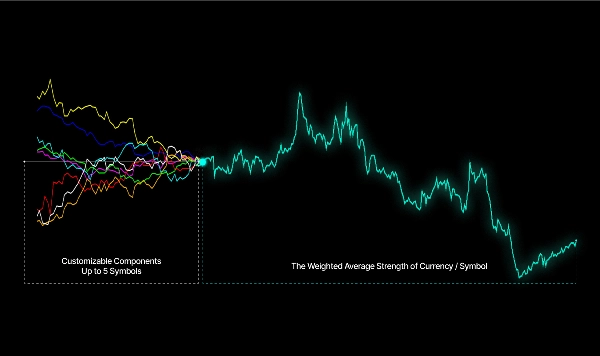
- Bileşik Sepet: Güç endeksi oluşturmak için eşit ağırlıkla 5 döviz çiftini (seçiminize göre) toplar
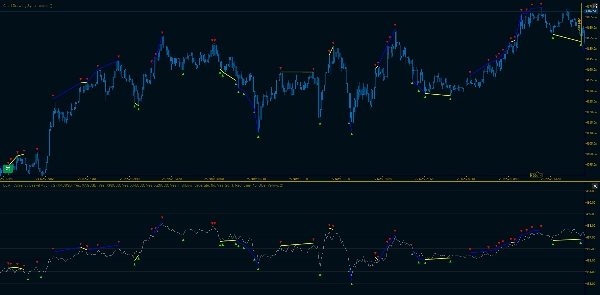
- Otomatik Fraktal Algılama: Yapılandırılabilir sol/sağ bar sayısına göre grafikteki pivot yüksek ve düşükleri tanımlar
- Sıralı Takip: Aynı türdeki ardışık pivot noktalarını (yüksekler veya düşükler) takip eder ve bunları trend çizgileriyle bağlar
- Uyumsuzluk Vurgulama: Fiyat ve sepet zıt yönlerde hareket ettiğinde (uyumsuzluk) trend çizgisi segmentlerini otomatik olarak sarıya, birlikte hareket ettiklerinde beyaza boyar
-------------------------------------------------------------------------------------------------------------------------------------------------------
Ağırlıklı Ortalama için Birden Fazla Hesaplama Modu
-------------------------------------------------------------------------------------------------------------------------------------------------------
- Kapanış: Kapanış fiyatlarını kullanarak tek düzgün çizgi
- Ağırlıklı (HL2): Yüksek ve düşük fiyatların ortalamasını kullanarak tek çizgi
- Yüksek/Düşük Ayrı: İki çizgi—yüksek fraktaller sepet yüksekleriyle, düşük fraktaller sepet düşükleriyle karşılaştırılır
-------------------------------------------------------------------------------------------------------------------------------------------------------
Özelleştirilebilir Ayarlar
-------------------------------------------------------------------------------------------------------------------------------------------------------
- Bireysel döviz çiftlerini etkinleştir/devre dışı bırak
- Ayarlanabilir pivot algılama hassasiyeti
- Fraktallar, trend çizgileri ve uyumsuzluklar için yapılandırılabilir renkler
- Alıntı para birimi gücünü analiz etmek için ters çevirme seçeneği
- Optimal görsel görüntüleme için ölçek çarpanı
Gösterge herhangi bir zaman diliminde çalışır ve kolay görsel karşılaştırma için fiyat grafiğiniz ile sepet paneli arasında algılanan tüm fraktalleri ve trend çizgilerini otomatik olarak yansıtır.
Özet
Müşteri değerlendirmeleri
5 | 100 % | |
4 | 0 % | |
3 | 0 % | |
2 | 0 % | |
1 | 0 % |


