Opis
Zaawansowany oscylator kanału cyklu Hursta — opis wskaźnika
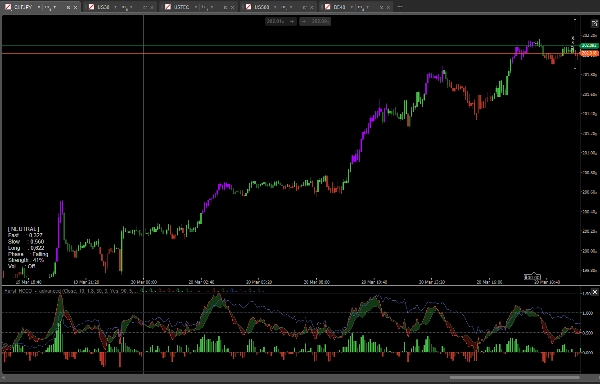
Zaawansowany oscylator kanału cyklu Hursta to profesjonalny wskaźnik momentum wielocyklicznego dla cTrader oparty na zasadach teorii cyklu Hursta. Zamiast mierzyć surowe momentum ceny, pozycjonuje bieżącą cenę w dynamicznie obliczanych kanałach cykli, dając traderom znormalizowany obraz, gdzie cena znajduje się w swoim naturalnym ruchu cyklicznym.
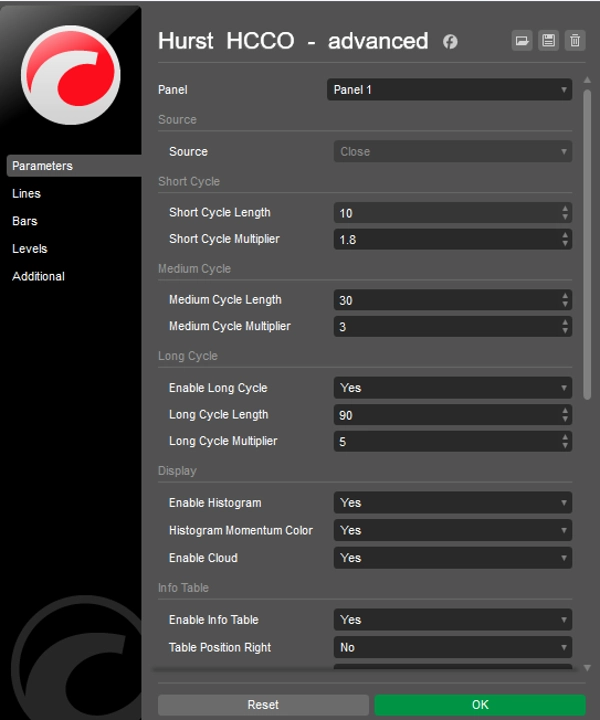
Trzy warstwy cykli
Wskaźnik oblicza trzy niezależne kanały cykli — krótki, średni i długi — każdy zbudowany z wykładniczej średniej kroczącej wyśrodkowanej w obrębie obwiedni opartej na ATR. Krótkie i średnie cykle napędzają główny oscylator, podczas gdy opcjonalny długi cykl zapewnia szerszy kontekst rynkowy. Wszystkie długości cykli i ich mnożniki ATR są w pełni konfigurowalne.
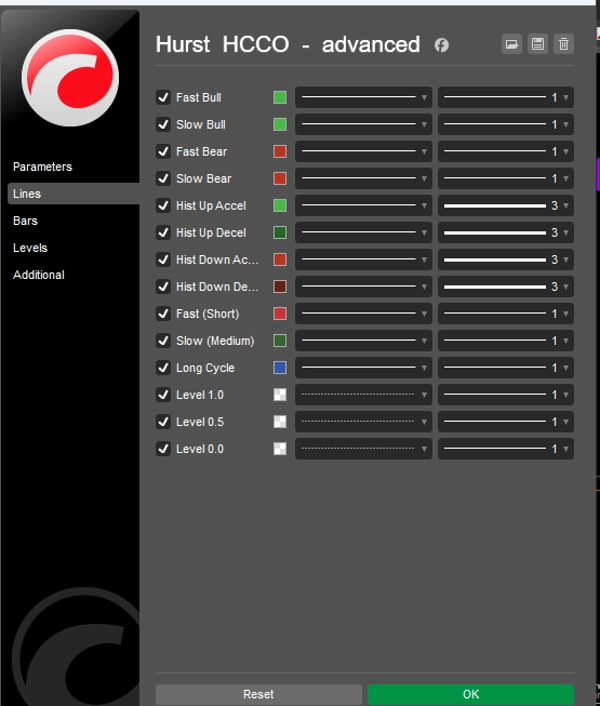
Szybka i wolna linia oscylatora
Linia szybka pokazuje, gdzie bieżąca cena znajduje się w kanale cyklu średniego — wartość powyżej 0,5 oznacza, że cena jest w górnej połowie swojego cyklu, poniżej 0,5 w dolnej połowie. Linia wolna reprezentuje punkt środkowy kanału cyklu krótkiego względem cyklu średniego, działając jako wygładzony punkt odniesienia. Razem tworzą oscylator dwuliniowy podobny w strukturze do MACD, ale oparty na geometrii cyklu.
Chmura cyklu
Opcjonalna chmura wypełnia obszar między liniami szybką i wolną. Zielona chmura powstaje, gdy linia szybka jest powyżej linii wolnej (byczy bias cyklu), czerwona chmura, gdy linia szybka jest poniżej linii wolnej (niedźwiedzi bias cyklu). Chmura sprawia, że relacja między dwoma warstwami cyklu jest natychmiast czytelna.
Histogram momentum
Histogram przedstawia różnicę między liniami szybką i wolną z czterokolorowym kodowaniem momentum — przyspieszające bycze, zwalniające bycze, przyspieszające niedźwiedzie, zwalniające niedźwiedzie. Ułatwia to zobaczenie nie tylko kierunku, ale także czy ruch cyklu zyskuje czy traci energię.
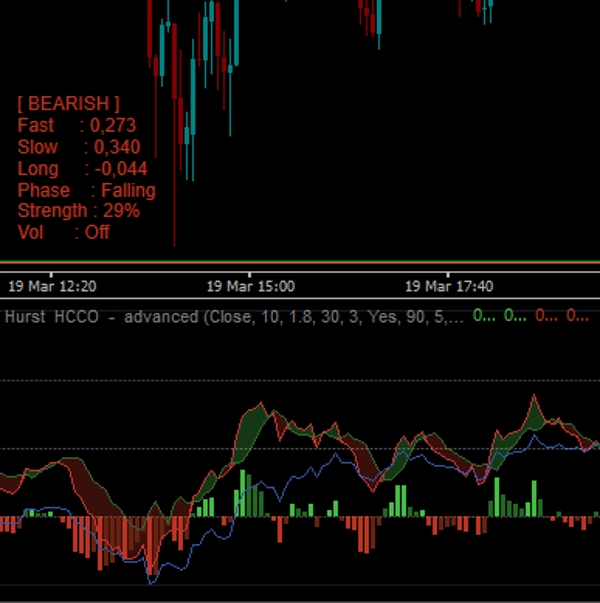
Wykrywanie fazy cyklu
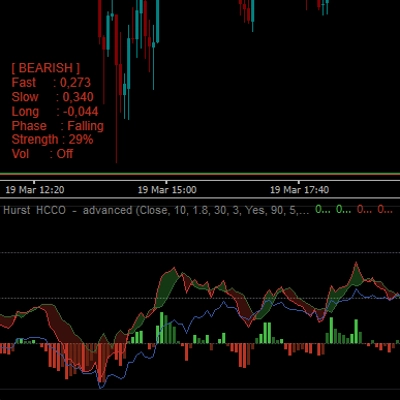
Tabela informacyjna pokazuje aktualną fazę cyklu: Dno, Przed dnem, Odbicie, Wzrost, Osłabienie, Po szczycie, Szczyt. Oznaczenia te pochodzą bezpośrednio z wartości oscylatora szybkiego i jego kierunku, dając traderom czytelny opis, gdzie rynek znajduje się w swoim cyklu.
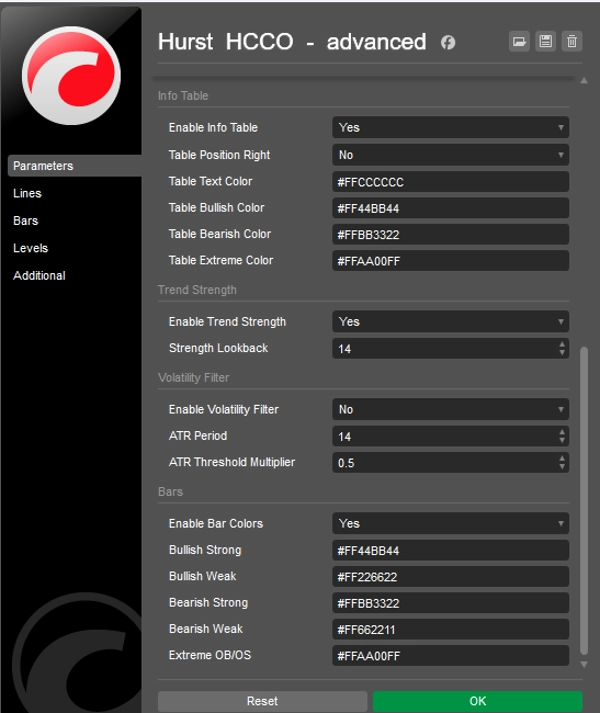
Siła trendu
Konfigurowalny okres wsteczny oblicza znormalizowany wynik siły trendu na podstawie tego, jak bardzo linia szybka odchyla się od punktu środkowego 0,5. Wynik jest wyświetlany jako procent w tabeli informacyjnej.
Filtr zmienności
Opcjonalny filtr zmienności oparty na ATR przyciemnia słupki histogramu i kolory słupków, gdy zmienność rynku spada poniżej konfigurowalnego progu, zapobiegając generowaniu mylących sygnałów oscylatora podczas warunków płaskich lub niestabilnych.
Tabela informacyjna
Kompaktowa tabela na wykresie pokazuje aktualny stan rynku (byczy, niedźwiedzi, neutralny, ekstremalny), wartości oscylatorów szybki, wolny i długi, fazę cyklu, procent siły trendu oraz status filtra zmienności. Pozycja i wszystkie kolory są konfigurowalne.
Kolorowanie słupków
Po włączeniu świece na wykresie są kolorowane na podstawie stanu oscylatora — silny byczy, słaby byczy, słaby niedźwiedzi, silny niedźwiedzi oraz ekstremalne wykupienie/wyprzedanie. Ekstremalne odczyty występują, gdy linia szybka wychodzi poza zakres 0,0–1,0, sygnalizując wybicie ceny poza kanał cyklu.
Podsumowanie kluczowych cech
- Trzy konfigurowalne warstwy cykli oparte na teorii cyklu Hursta
- Podwójny oscylator szybki/wolny znormalizowany do pozycji w kanale cyklu
- Chmura cyklu między liniami szybką i wolną
- Czterokolorowy histogram momentum
- Automatyczne wykrywanie fazy cyklu z opisami w języku potocznym
- Procentowa siła trendu w czasie rzeczywistym
- Filtr zmienności oparty na ATR
- Tabela informacyjna na wykresie z pełnym podziałem stanu rynku
- Opcjonalne kolorowanie świec
- Wszystkie kolory w pełni konfigurowalne z obsługą kanału alfa
- Brak przerysowań
Podsumowanie
Opinie klientów
5 | 100 % | |
4 | 0 % | |
3 | 0 % | |
2 | 0 % | |
1 | 0 % |


