
الوصف
MACD Sniper Elite Multi-Timeframe هو خريطة حرارة MACD متعددة الأطر الزمنية مصممة بدقة للمتداولين الذين يرغبون في محاذاة الاتجاه بشكل أسرع، وتأكيد زخم أنظف، وتوقيت تداول أكثر دقة.
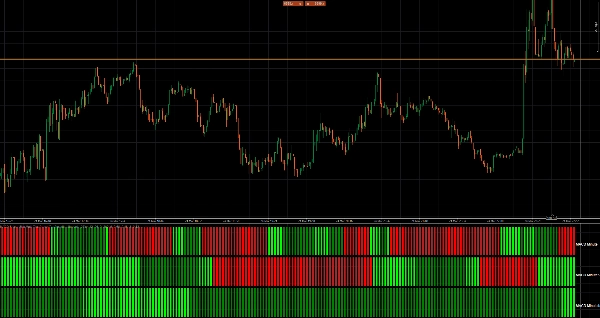
بدلاً من مراقبة عدة مخططات ومقارنة شروط MACD عبر الأطر الزمنية يدويًا، يقوم هذا المؤشر بضغط تلك المعلومات في نافذة فرعية قوية واحدة مع تخطيط بصري نظيف مكون من 3 صفوف. يمثل كل صف إطارًا زمنيًا قابلًا للاختيار ويظهر فورًا ما إذا كان زخم MACD يتقوى، يتلاشى، صعودي، أو هبوطي.
النتيجة بسيطة: يمكنك اكتشاف المحاذاة بشكل أسرع، تصفية الإعدادات الضعيفة مبكرًا، والتركيز على الدخولات ذات الاحتمالية العالية بثقة أكبر.
لماذا يحب المتداولون هذا المؤشر
وضوح متعدد الأطر الزمنية بنظرة واحدة
شاهد شروط MACD من 3 أطر زمنية مختلفة في لوحة مدمجة واحدة.
مصمم لاتخاذ قرارات سريعة
لا حاجة بعد الآن للتبديل بين المخططات لتأكيد اتجاه الزخم.
تصوير قوة الاتجاه
محرك الألوان يفعل أكثر من مجرد إظهار الاتجاه. كما يبرز ما إذا كان الزخم يتسارع أو يضعف.
دخولات بأسلوب القناص
مثالي للمتداولين الذين يرغبون في محاذاة الدخولات في الأطر الزمنية الأدنى مع زخم الأطر الزمنية الأعلى.
تصميم نظيف وفعال
العرض بسيط، قابل للقراءة، ومحسن لتحليل المخططات بسرعة.
كيف يعمل
يستخدم المؤشر خريطة حرارة متعددة الأطر الزمنية مكونة من 3 صفوف.
- الصف 1 = إطار زمني MACD قابل للاختيار
- الصف 2 = إطار زمني MACD قابل للاختيار
- الصف 3 = إطار زمني MACD قابل للاختيار
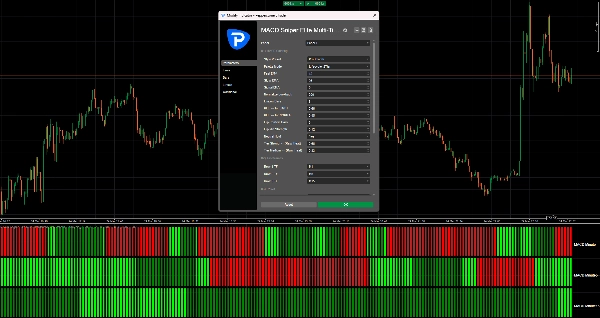
يحسب كل صف MACD الخاص به باستخدام:
- EMA السريع
- EMA البطيء
- EMA الإشاري
افتراضيًا، يستخدم المؤشر إعدادات MACD الكلاسيكية:
- EMA السريع = 12
- EMA البطيء = 26
- EMA الإشاري = 9
منطق الألوان
يتم ترميز كل صف بالألوان ليُظهر كل من:
- الاتجاه
- جودة الزخم
درجات اللون الأخضر تشير إلى ضغط MACD صعودي.
درجات اللون الأحمر تشير إلى ضغط MACD هبوطي.
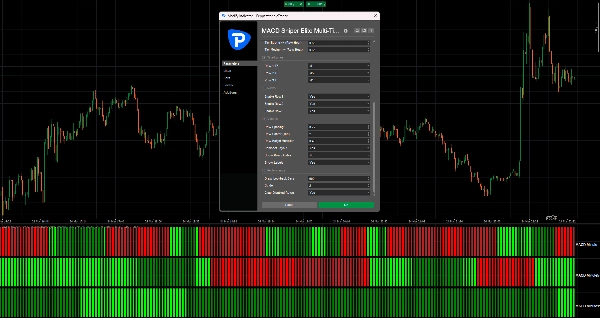
اعتمادًا على وضع اللوحة المختار، يمكن للألوان أن تظهر:
- تنشيط اتجاه قوي
- زخم اتجاه مستمر
- ظروف اتجاه تضعف
- شدة الزخم الخام
وضع دورة الحياة ذات المستويين
هذا هو أحد أقوى الأوضاع البصرية في المؤشر.
في هذا الوضع:
- أخضر فاتح / أحمر فاتح = زخم اتجاه جديد أو قوي
- أخضر عادي / أحمر عادي = الزخم لا يزال صالحًا، لكنه يبدأ في الضعف
هذا يجعل من الأسهل بكثير تحديد ما إذا كانت الحركة لا تزال تتوسع أو تفقد قوتها بالفعل.
وضع دورة الحياة ذات الثلاث مستويات ووضع الحرارة الخام
للمتداولين الذين يرغبون في مزيد من التفاصيل البصرية، يتضمن المؤشر أيضًا:
- دورة حياة ذات 3 مستويات
- حرارة خام ذات 3 مستويات
تضيف هذه الأوضاع المزيد من التدرج لقوة الزخم وتطور الاتجاه.
أفضل حالات الاستخدام
MACD Sniper Elite Multi-Timeframe مثالي للمتداولين الذين يرغبون في:
- محاذاة الدخولات في الأطر الزمنية الأدنى مع التحيز في الأطر الزمنية الأعلى
- تجنب التداول ضد الزخم
- تأكيد استمرار الاتجاه
- اكتشاف الاتجاهات الضعيفة قبل أن تصبح الانعكاسات واضحة
- تبسيط التحليل متعدد الأطر الزمنية
يعمل بشكل جيد بشكل خاص مع:
- التداول السريع (سكالبينج)
- التداول اليومي داخل اليوم
- التداول اليومي
- تداول الزخم
- استراتيجيات متابعة الاتجاه
مثال على سير العمل
طريقة شائعة لاستخدام المؤشر هي:
- الصف 1 = زخم إطار الدخول
- الصف 2 = إطار التأكيد
- الصف 3 = تحيز الإطار الزمني الأعلى
على سبيل المثال:
- الصف 1 = M1
- الصف 2 = M5
- الصف 3 = M15
عندما تتحول كل الصفوف إلى صعودية، يكون الزخم محاذيًا.
عندما يضعف الصف السفلي بينما تظل الصفوف العليا قوية، قد يشير ذلك إلى ارتداد أو حركة في مرحلة متأخرة.
عندما تتحول كل الصفوف معًا، غالبًا ما يشير ذلك إلى مرحلة اتجاهية أقوى.
المزايا الرئيسية
- 3 أطر زمنية MACD قابلة للاختيار بالكامل
- الإعدادات الافتراضية الكلاسيكية لـ MACD متضمنة
- محرك ألوان خريطة حرارة متميز
- تصوير دورة حياة الاتجاه
- تصميم نافذة فرعية مدمجة
- تسميات سهلة القراءة
- محسن لسير عمل أسرع
- مثالي للمتداولين الذين يبحثون عن دقة في الدخولات
الملخص
تقييمات العملاء
5 | 50 % | |
4 | 50 % | |
3 | 0 % | |
2 | 0 % | |
1 | 0 % |


