
설명
🔷 트렌드 라인 프리미엄 엔진
다중 레이어 시장 구조 및 동적 회귀 지표
https://chartshots.spotware.com/c/69d3c949a2e08
📌 이것은 무엇인가요?
트렌드 라인 프리미엄 엔진은 5개의 독립 모듈을 하나의 도구로 결합한 오버레이 지표입니다. 각 모듈은 켜거나 끌 수 있습니다. 가격 차트에 시장 구조, 동적 채널, 거래량 기반 회귀 구역을 직접 매핑합니다.
세 가지 핵심 질문에 답합니다:
- 현재 구조 내에서 가격은 어디에 있나요?
- 지배적인 추세는 무엇이며, 돌파 지점은 어디인가요?
- 어떤 가격대에 활동이 집중되어 있나요?
🧩 5개의 모듈
1️⃣ 스윙 범위 연결기
https://chartshots.spotware.com/c/69d3cab9b805b
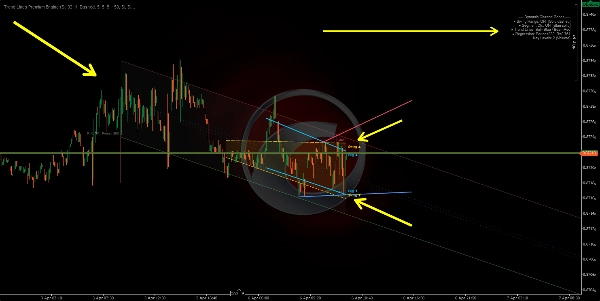
가장 최근의 스윙 고점과 저점을 감지한 후, 양쪽에서 가장 오래된 것과 최신 것을 연결하는 경사 채널을 그립니다. 그 사이 영역은 동적 범위 구역으로 채워집니다.
작동 원리:
- 바의 고가(또는 저가)가 앞뒤 N개의 바와 비교해 가장 극단적일 때 스윙 포인트로 간주됩니다.
- 가장 오래된 저장된 스윙에서 가장 최근 스윙까지 직선을 그려 상하 경계를 만듭니다.
- 새로운 스윙 포인트가 확인될 때마다 채널이 자동으로 이동합니다.
읽는 방법:
- 채널 내 가격 → 정의된 구조적 범위.
- 상하 돌파 → 변동성 확장 또는 구조 변화.
- 채널 기울기 → 주된 범위 방향.
매개변수
목적
스윙 전후 바 수
스윙을 확인하기 위해 각 측면에 필요한 바 수. 높을수록 더 중요한 스윙
최대 스윙 포인트
저장할 스윙 수. 채널 깊이 제어
히스토리 창
채널이 그려지는 과거 범위
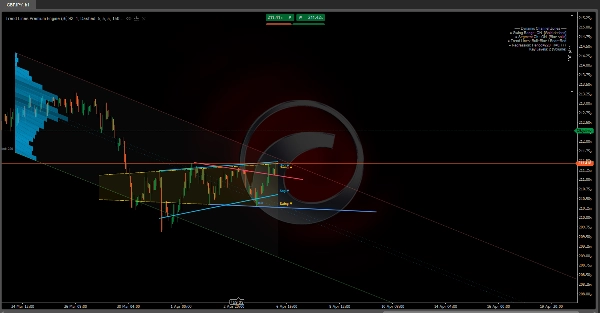
2️⃣ 세그먼트 선형 채널
https://chartshots.spotware.com/c/69d3cb221bba1
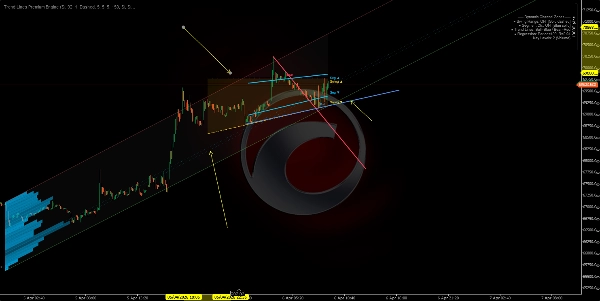
분석 창을 5개의 동일 세그먼트로 나누고, 각 세그먼트에서 최고 고가와 최저 저가를 찾은 후, 그 5개의 상단 점을 통해 최소제곱 회귀선과 5개의 하단 점을 통해 또 다른 회귀선을 맞춥니다.
작동 원리:
- 창을 5부분으로 나누고 각 부분에서 대표 극단값을 추출합니다.
- 각 경계에 대해 5점에 선형 회귀를 적용합니다.
- 결과는 단순히 두 끝점이 아닌 분할된 가격 구조에 적응하는 채널입니다.
읽는 방법:
- 상승 채널 → 구조적 상승 추세.
- 하락 채널 → 구조적 하락 추세.
- 경계에 반복적으로 닿음 → 동적 지지/저항.
모듈 1과의 차이점: 스윙 범위는 첫 번째와 마지막 스윙만 연결하지만, 세그먼트 채널은 5점 회귀를 사용하여 더 부드럽고 단일 스윙에 덜 민감합니다.
3️⃣ 스윙 포인트 라벨
스윙 고점과 저점을 감지하고 이를 4가지 시장 구조 범주로 분류합니다:
라벨
의미
표시
HL
상승 저점
강세 구조
HH
상승 고점
강세 구조
LH
하락 고점
약세 구조
LL
하락 저점
약세 구조
작동 원리:
- 새로운 스윙 저점은 이전 스윙 저점과 비교됩니다. 더 높으면 → HL, 더 낮으면 → LL.
- 새로운 스윙 고점은 이전 스윙 고점과 비교됩니다. 더 높으면 → HH, 더 낮으면 → LH.
읽는 방법:
- HL + HH 시퀀스 → 상승 추세 유지.
- LH + LL 시퀀스 → 하락 추세 유지.
- HL이 LL로 깨지거나, LH가 HH로 깨지는 경우 → 구조 변화 (BOS/CHoCH).
기본적으로 차트를 깔끔하게 유지하기 위해 HL과 LH만 표시됩니다. 전체 구조 가시성을 위해 HH와 LL을 활성화할 수 있습니다.
4️⃣ 자동 트렌드 라인
https://chartshots.spotware.com/c/69d3cc071272e
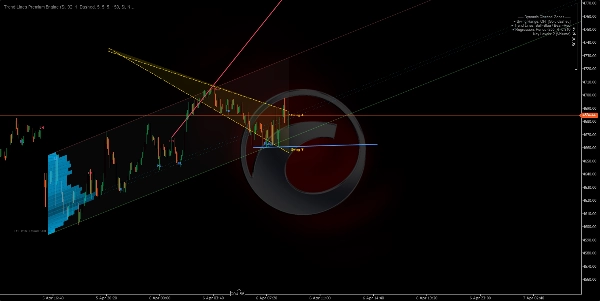
가장 최근의 두 스윙 저점(강세선)과 가장 최근의 두 스윙 고점(약세선)을 연결하는 트렌드 라인을 그립니다. 활성 라인은 두드러지게 표시되고 이전 라인은 희미해집니다.
작동 원리:
- 새로운 스윙 저점 감지 → 이전 스윙 저점에서 새 저점으로 선을 그림(강세 추세선).
- 새로운 스윙 고점 감지 → 이전 스윙 고점에서 새 고점으로 선을 그림(약세 추세선).
- 선은 구성 가능한 바 수만큼 앞으로 투사됩니다.
- 새 선이 생성되면 이전 선은 반투명 색으로 희미해집니다.
돌파 신호(선택 사항): 활성화 시, 지표는 종가가 활성 트렌드 라인을 넘는지 감지합니다:
- 🔼 위쪽 화살표 → 강세 돌파.
- 🔽 아래쪽 화살표 → 약세 돌파.
매개변수
목적
최대 라인 쌍
표시할 라인 쌍 수. 가장 깔끔한 보기를 위해 1로 설정
최대 확장 바
선이 앞으로 투사되는 거리. 선이 차트 전체를 가로지르는 것을 방지
5️⃣ 동적 회귀 구역
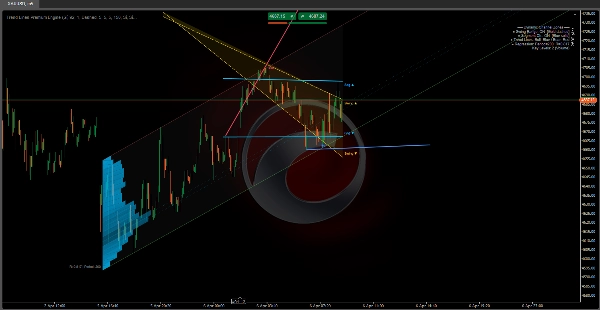
가장 진보된 모듈입니다. 종가에 대해 선형 회귀 채널을 계산하고, 채널 내에서 거래량 또는 접촉이 집중된 위치를 보여주는 활동 프로필(히스토그램)을 오버레이합니다. 또한 가장 활동이 많은 구역에서 핵심 수준을 표시합니다.
A) 회귀 채널:
- 주어진 기간 동안 종가에 최소제곱 선형 회귀를 적용합니다.
- 회귀선으로부터 가격의 표준 편차를 계산합니다.
- 중심에서 N 표준 편차(기본값: 2.0) 떨어진 상단 및 하단 밴드를 배치합니다.
- 고가 또는 고변동성 상품에 대해 더 정확한 계산을 위해 로그 스케일로 선택적 계산이 가능합니다.
B) 자동 기간 감지:
- 알고리즘은 여러 기간(50~400 바)을 테스트하고 각 기간에 대해 피어슨 상관 계수를 계산합니다.
- 선형 회귀가 가격 움직임에 가장 잘 맞는 상관 계수가 가장 높은 기간을 선택합니다.
- 상관 계수 값이 차트에 표시됩니다(예: R = 0.85).
C) 활동 히스토그램:
- 채널을 최대 25개의 수평 구간으로 나눕니다.
- 각 구간에 대해 알고리즘은 해당 가격 수준에 닿은 바 수를 거래량 또는 접촉 횟수(구성 가능)로 가중하여 계산합니다.
- 활동이 높은 구간은 더 길고 불투명한 막대로 나타납니다.
- 이를 통해 채널 내 제어점(POC)과 고/저 활동 구역을 확인할 수 있습니다.
D) 핵심 수준:
- 가장 활동이 많은 구간은 앞으로 수평선으로 투사됩니다.
- 이들은 회귀 맥락 내에서 거래량 기반 지지 및 저항 역할을 합니다.
읽는 방법:
- 가격이 상단 밴드 근처에 있으면 통계적으로 과매수 구역입니다.
- 가격이 하단 밴드 근처에 있으면 통계적으로 과매도 구역입니다.
- R 값이 1 또는 -1에 가까우면 강력하고 신뢰할 수 있는 선형 추세입니다. R 값이 0에 가까우면 횡보 또는 회귀가 중요하지 않습니다.
- 핵심 수준은 가격 자석 역할을 하며, 과거 활동 집중 구역이 가격을 다시 끌어당기는 경향이 있습니다.
🎯 사용 사례
사용 사례
모듈
시장 구조 식별 (강세/약세/횡보)
스윙 라벨 + 트렌드 라인
동적 지지 및 저항 감지
스윙 범위 + 세그먼트 채널
거래량으로 가치 구역 찾기
회귀 구역 + 핵심 수준
구조 돌파 확인
트렌드 라인 + 돌파 신호
추세 강도 측정
피어슨 상관 계수 (회귀 구역)
⚙️ 스타일별 권장 설정
스타일
추천 모듈
스캘핑 (M1–M15)
스윙 라벨 + 트렌드 라인
인트라데이 (M15–H1)
모든 모듈
스윙 트레이딩 (H4–D1)
스윙 범위 + 회귀 구역 + 핵심 수준
순수 구조 분석
스윙 라벨 + 트렌드 라인만
⚠️ 중요 참고 사항
요약
The five modules include:
1. Swing Range Connector: Detects recent swing highs and lows to draw a sloped channel representing the structural range.
2. Segment Linear Channel: Divides the analysis window into five segments, fitting regression lines through highs and lows for a smoother channel.
3. Swing Point Labels: Classifies swing highs and lows into four market structure categories (Higher High, Higher Low, Lower High, Lower Low) to indicate bullish or bearish trends and structure shifts.
4. Automatic Trend Lines: Connects the two most recent swing highs and lows with trend lines, highlighting active lines and optionally signaling breakouts.
5. Dynamic Regression Zone: Calculates a linear regression channel on closing prices with an activity histogram showing volume or touch concentration, marking key volume-based support and resistance levels.
The indicator supports various trading styles, recommending specific module combinations for scalping, intraday, swing trading, and pure structure analysis. It requires price bars and volume data and provides visualizations and signals including breakout, trend strength, and level touches or breaks.


