
Açıklama
Pinescriptlabs Mağaza göstergeleri: 🤖Pinescriptlabs Mağaza cBots : (cBot)
Altın & BTC KırılmaOturum Pivotları(yeni)
SmartTrend Destek &
Direnç
Çizgileri
Dinamik
Piyasa Yapısı
Analizi
dönüm
Noktaları
Fibonacci
Doğrusal
Regresyon
Çoklu zaman dilimi
Çok Katmanlı
Mum Önyargısı
Takipçisi
Otomatik
Destek ve
Direnç
Trend
Çizgileri
Tüm
Destek ve
Direnç
Düzeyleri
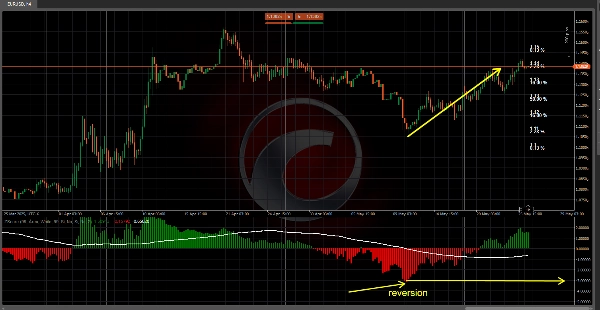
Z-Skoru fiyatı "standart
sapma" ölçeğine dönüştürür,
her mumun kapanışının (veya açılış, yüksek, düşük) tarihsel ortalamasından ne kadar saptığını gösterir. Sezgisel bir görselle aşırı alım/aşırı satım
koşullarını ve
yüksek olasılıklı dönüş bölgelerini tanımlamaya yardımcı olur! 🔄
1️⃣ Ne Yapar?
🔹 Fiyatı Standardize Eder: Mutlak kapanış değerini bir Z-Skoru’na dönüştürür—ortalama değerinden kaç standart sapma uzaklıkta olduğunu gösterir
son N bar için.
🔹 İstatistiksel
Uç Noktaları Vurgular: Değerler
yaklaşık ±1, ±2 veya ±3 fiyat hareketinde nadirliği gösterir:
- ±1 SD (≈ –1 ile 1 arasında %68 olasılık)
- ±2 SD (≈ –2 ile 2 arasında %95 olasılık)
- ±3 SD (≈ –3 ile 3 arasında %99,7 olasılık)
🔹 Ortalama Dönüş Ticaretine
yardımcı olur:
Z-Skoru ±2 veya ±3’ü aştığında, piyasa aşırı
bölgede ve ortalamaya (sıfıra) dönme eğilimindedir.
🔹 Net
Görselleştirme: histogramlar (veya özel mumlar), hareketli ortalama çizgisi ve renkli bölgeler kullanarak, fiyatın "normal" davranıp davranmadığını veya istatistiksel bir
aykırı değer olduğunu anında görebilirsiniz.
2️⃣ Nasıl Çalışır?
📐 Ortalama ve Standart Sapma Hesaplaması
- Bir
geri bakış dönemi (örneğin, 99
bar) kullanılır. - Kapanış fiyatlarının ortalaması ve standart
sapması (SD) hesaplanır. - Yüksek SD = Fiyat hareketlerinde daha fazla volatilite.
🧮 Z-Skoru Formülü
Z=Mevcut Kapanış−Tarihsel OrtalamaStandart SapmaZ=Standart SapmaMevcut Kapanış−Tarihsel Ortalama
- Pozitif Z → Kapanış ortalamanın üzerinde.
- Negatif Z → Kapanış ortalamanın altında.
📊 Z-Tablosu Olasılıkları
- Mevcut Z-Skoru sütununu vurgulayarak fiyatın ne kadar
nadir/aşırı olduğunu gösterir!
3️⃣ Ticarette Nasıl Kullanılır
✅ Ortalama Dönüş: Tersine işlem yapmak için Z > +2 veya Z < –2 arayın (aşırı alım
uçlarını satın, aşırı satım uçlarını satın).
✅ Trend Onayı: Sürekli bir Z
> 0 + yükselen hareketli ortalama güç sinyali verir;
Z < 0 + düşen hareketli ortalama zayıflık gösterir.
✅ Risk Yönetimi: Yaklaşık ±1 SD, normal hareketler bekleyin; ±3
SD civarında, stopları ve pozisyon büyüklüklerini dikkatlice ayarlayın.
✅ Giriş Zamanlaması: Kesin girişler için aşırı Z-Skorlarını destek/direnç
düzeyleri ile birleştirin.
4️⃣ Avantajlar ve Dikkat Edilmesi Gerekenler
✔️ Avantajlar
- Aşırı fiyat koşullarını tespit etmede istatistiksel avantaj.
- Birden fazla görüntüleme modu (histogram, mumlar, bantlar, olasılık
tablosu). - Kolay özelleştirme (uzunluk, renkler, grafik türü).
⚠️ Dikkat Edilmesi Gerekenler:
- Güçlü
trendlerde fiyat uzun süre "aşırı" kalabilir. - Normal
dağılım varsayar—çok volatil/çarpık piyasalarda iyi çalışmayabilir. - En iyi şekilde
istikrarlı volatilite ortamlarında kullanılır.
Özet
The indicator calculates the mean and standard deviation of recent closing prices to determine the Z-Score using the formula:
Z = (Current Close − Historical Mean) / Standard Deviation.
Positive Z-Scores indicate prices above the mean, while negative scores indicate prices below it.
ZScore Reversion provides clear visualizations through histograms, special candles, moving averages, and colored zones to distinguish normal price behavior from statistical outliers. It supports mean reversion trading by signaling when prices exceed ±2 or ±3 standard deviations, suggesting a likely return to the mean. It also aids trend confirmation by interpreting sustained positive or negative Z-Scores combined with moving average trends.
Risk management is facilitated by adjusting stops and position sizes near extreme Z-Score values. Entry timing can be refined by combining extreme Z-Scores with support and resistance levels. The indicator offers multiple display modes and customization options for length, colors, and chart types. It is best suited for stable volatility environments and assumes a normal distribution of price data.
Müşteri değerlendirmeleri
5 | 100 % | |
4 | 0 % | |
3 | 0 % | |
2 | 0 % | |
1 | 0 % |


