설명
ADX 고급 클라우드 및 모멘텀 시스템
표준 평균 방향 지수(ADX)는 강력한 도구이지만 솔직히 말해서 세 개의 교차하는 선(+DI, -DI, 및 ADX)을 바라보는 것은 복잡하고 혼란스러우며 눈에 부담을 줍니다.
ADX 고급 지표는 이 고전적인 도구를 완전히 현대화합니다. 혼란스러운 선들을 명확하고 시각적인 강력한 도구로 변환하여 누가 시장을 지배하는지(강세 vs. 약세)와 추세가 얼마나 강한지를 한눈에 알려줍니다.
주요 기능
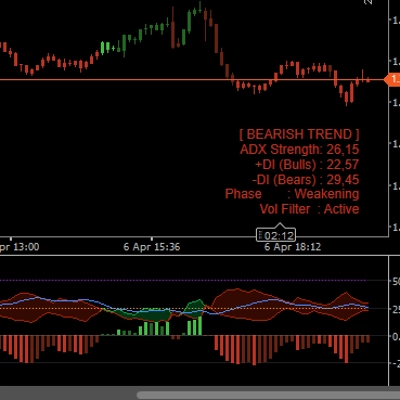
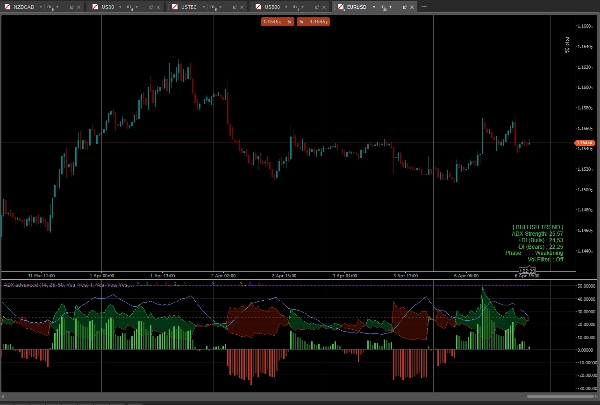
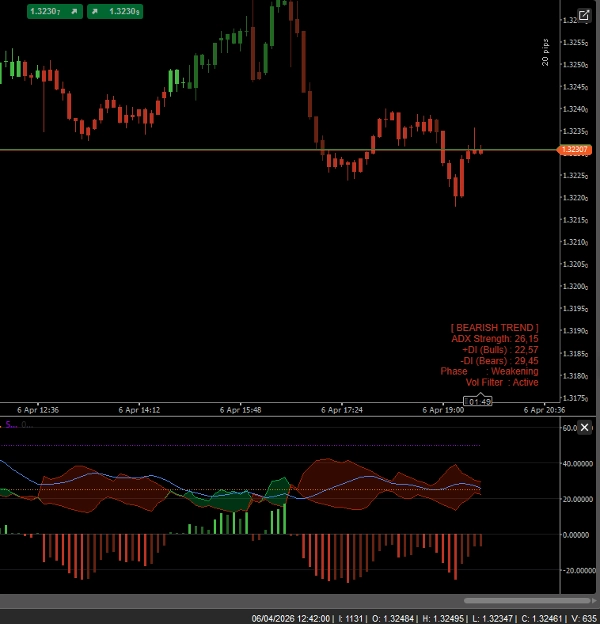
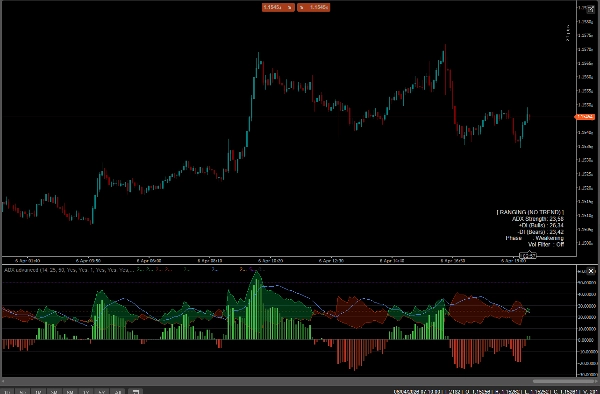
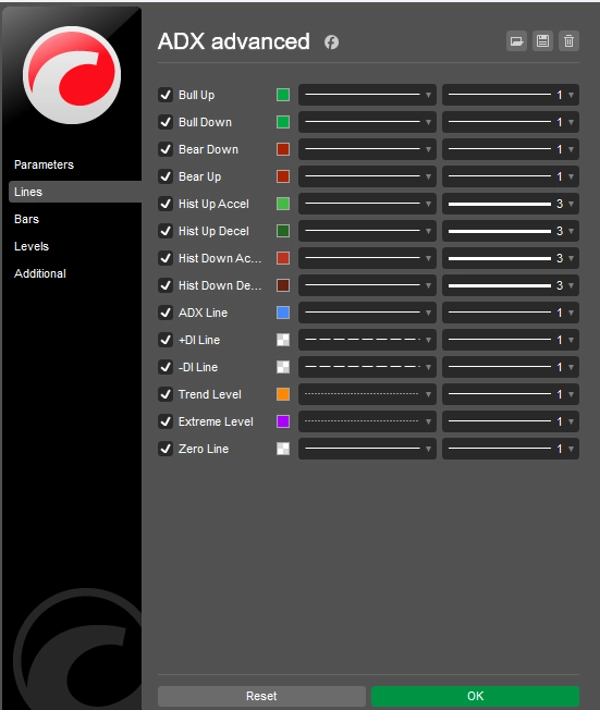
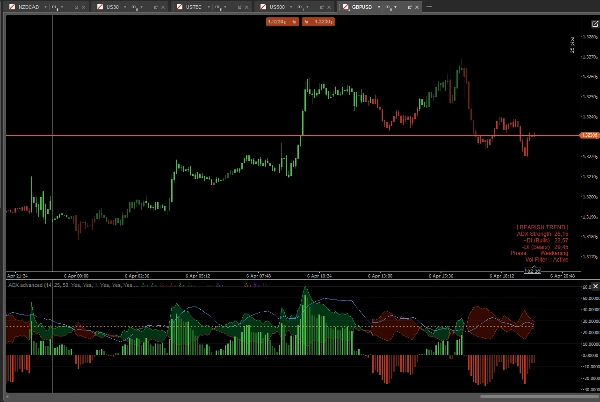
- 방향성 클라우드(DI 클라우드): 교차하는 선 대신 +DI와 -DI 사이 공간이 동적인 색상의 클라우드로 채워집니다. 녹색 클라우드 = 강세가 지배. 빨간 클라우드 = 약세가 지배.
- 모멘텀 히스토그램: 지표 하단에 맞춤 제작된 히스토그램이 +DI와 -DI 사이의 정확한 거리를 측정합니다. 가속/감속 색상을 특징으로 하여 추세가 실제로 반전되기 전에 모멘텀 감소를 포착할 수 있습니다.
- 스마트 바 색상(페인트바): 지표가 추세 강도에 따라 직접 가격 캔들을 칠합니다!
-
- 밝은 녹색/빨간색: 강한 추세 (ADX > 25 및 +DI/-DI 정렬)
- 어두운 녹색/빨간색: 약한 추세 / 횡보 (ADX < 25)
- 보라색/마젠타: 극단적 과도 추세 (ADX > 50) - 되돌림에 대비하세요!
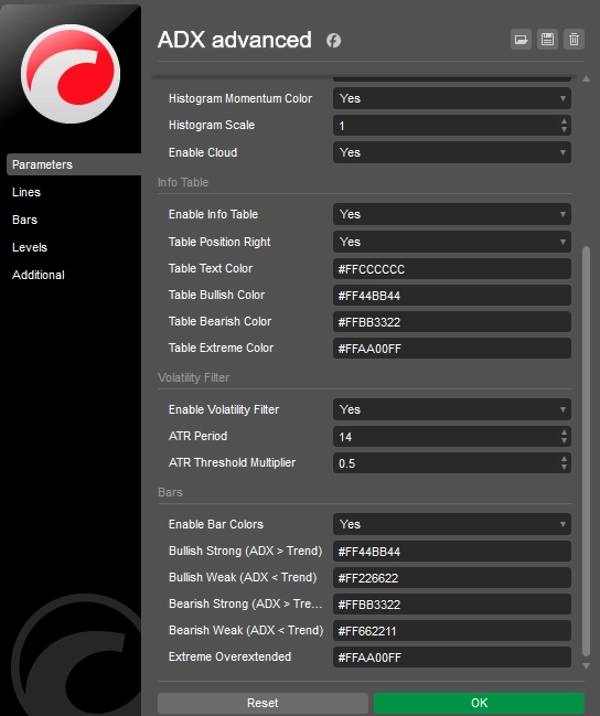
- 차트 내 정보 패널: 세련되고 방해되지 않는 대시보드가 현재 시장 상태(추세, 횡보, 극단), ADX 강도 및 모멘텀 단계를 실시간으로 표시합니다.
- 내장 변동성 필터(ATR): 시장이 완전히 횡보할 때 캔들과 히스토그램 바를 회색으로 처리하는 선택적 ATR 필터로 잡음 거래를 방지합니다.
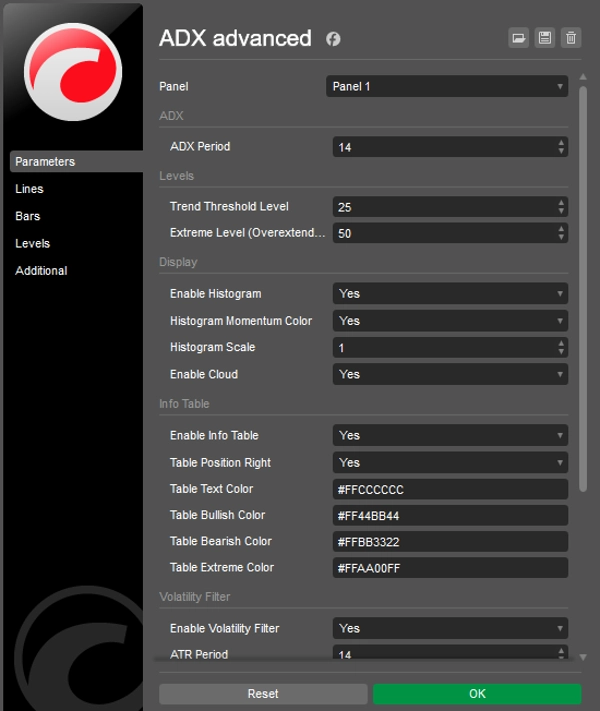
- 완전한 사용자 정의 가능: 색상, 임계값(추세 수준 25, 극단 수준 50), 히스토그램 스케일을 변경하여 개인 거래 스타일과 차트 테마에 맞출 수 있습니다.
사용 방법?
- ADX 파란선이 25 임계값을 상향 돌파할 때까지 기다리세요 (추세 활성화).
- 클라우드와 히스토그램을 보고 방향을 확인하세요 (롱은 녹색, 숏은 빨간색).
- 돌파를 거래하고 캔들이 "강한" 색상으로 칠해져 있는 동안 추세를 타세요.
- ADX 선이 50 극단 수준을 돌파할 때 이익을 실현하거나 스톱을 추적하세요 (캔들이 보라색으로 변함).
요약
지표 프로필
고객 리뷰
4.3
리뷰: 3
5 | 33 % | |
4 | 67 % | |
3 | 0 % | |
2 | 0 % | |
1 | 0 % |
고객 리뷰
April 16, 2026
April 12, 2026
상담
자주 묻는 질문(FAQ)
BTCUSD
Forex
Signal
Indices
EURUSD
Commodities
GBPUSD
NZDUSD
Prop
XAUUSD
NAS100
ATR
USDJPY
트레이딩 봇, 지표, 플러그인 등 cTrader Store에서 제공되는 상품은 제3자 개발자에 의해 제공되며, 이는 단순히 정보 및 기술적 접근을 목적으로 제공된 것입니다. cTrader Store는 중개인이 아니며, 투자 조언, 개인별 추천 또는 향후 성과에 대한 어떠한 보장도 제공하지 않습니다.


!["Gaussian Channel [Iridio Capital]" 로고](https://cdn.ctrader.com/image/webp/7c039209-5573-4a54-a072-f9528b503103_41960)


가격
24
판매
677
무료 설치