present
ลงทะเบียนและรับส่วนลด $50 สำหรับการซื้อครั้งแรกของคุณ
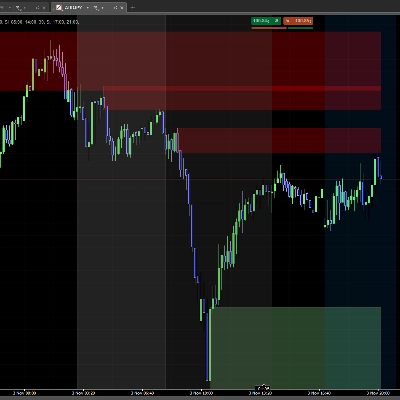
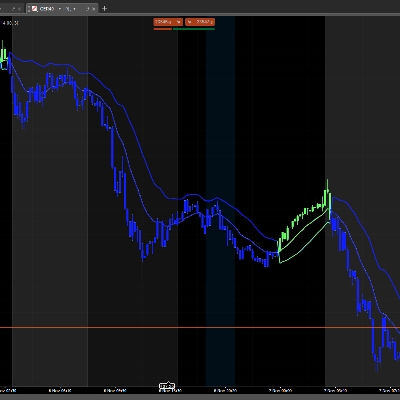
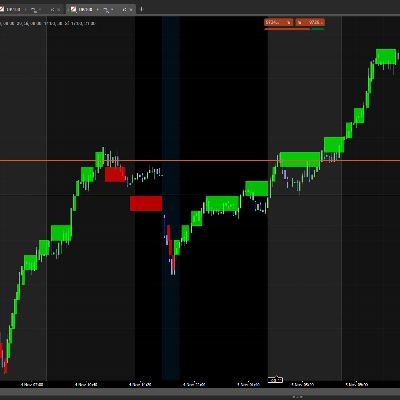
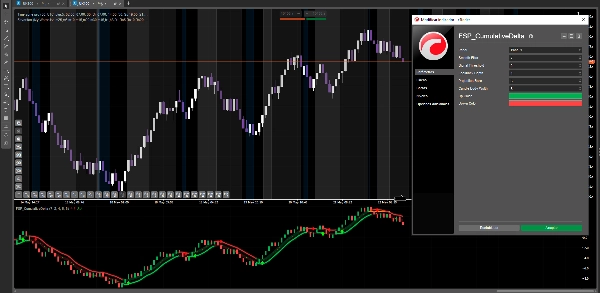
Trading product for FSP_CumulativeDelta อินดิเคเตอร์ Volume, image 1
FSP_CumulativeDelta
อินดิเคเตอร์
เวอร์ชัน 1.0, May 2026
Windows, Mac
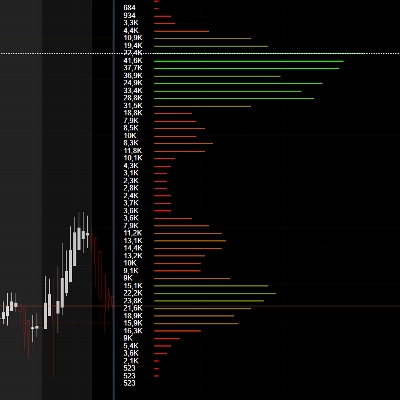
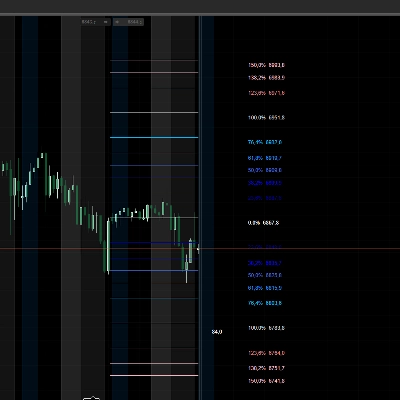
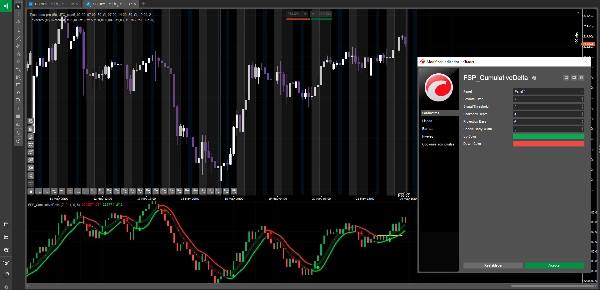
Trading product for FSP_CumulativeDelta อินดิเคเตอร์ Volume, image 2
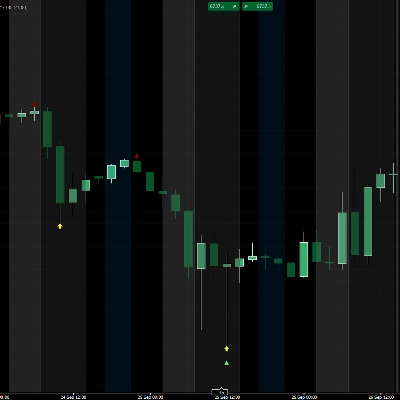
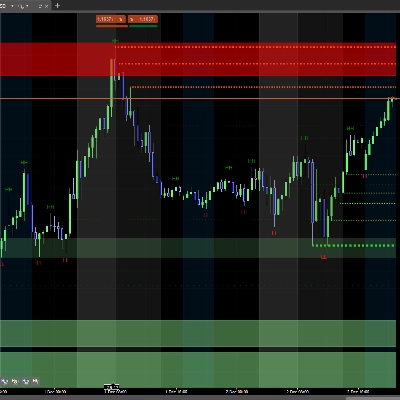
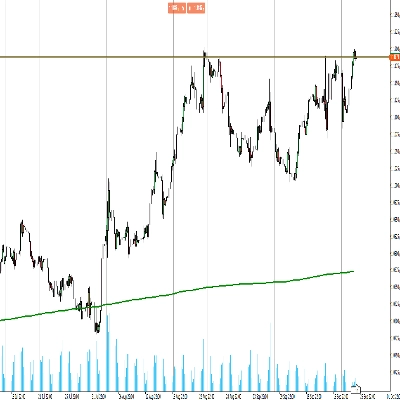
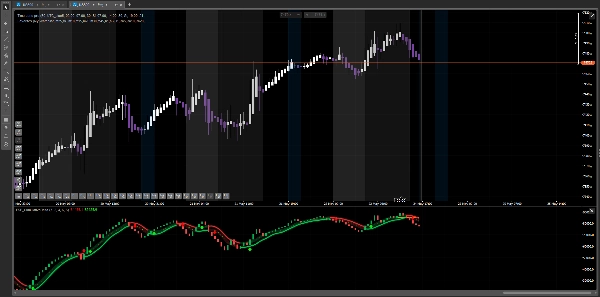
Trading product for FSP_CumulativeDelta อินดิเคเตอร์ Volume, image 3
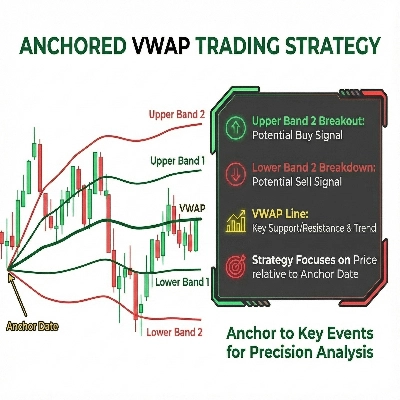
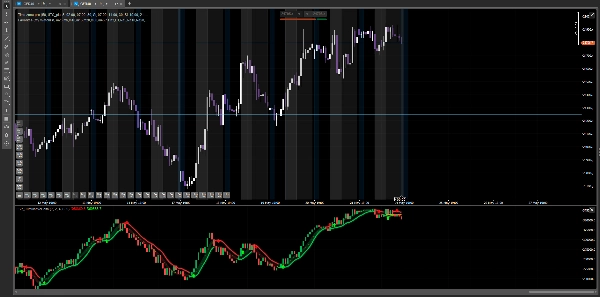
Trading product for FSP_CumulativeDelta อินดิเคเตอร์ Volume, image 4
Trading product for FSP_CumulativeDelta อินดิเคเตอร์ Volume, image 5
ตั้งแต่ 24/02/2025
18
การขาย
2.21K
ติดตั้งฟรี

คำอธิบาย

FSP CumulativeDelta — ตัวชี้วัดแรงกดดันตลาด

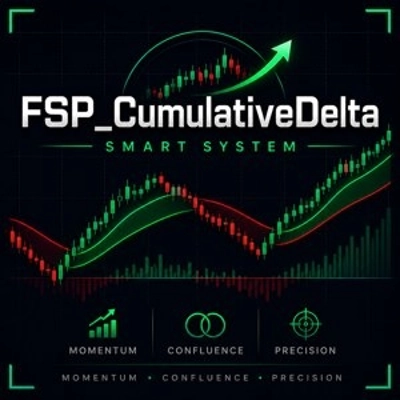
FSP CumulativeDelta เป็นตัวชี้วัดขั้นสูงที่รวมเครื่องมือทรงพลังสองอย่างไว้ในหน้าต่างเดียว: การวิเคราะห์แรงกดดันซื้อและขายทีละแท่ง พร้อมกับระบบตรวจจับแนวโน้มที่ช่วยให้คุณระบุช่วงเวลาที่ตลาดเปลี่ยนทิศทางได้อย่างแม่นยำ

มันทำอะไรได้บ้าง? ตัวชี้วัดจะแสดงแท่งเทียนแรงกดดันตลาดในกราฟย่อยแยกต่างหาก — ไม่ใช่ราคา แต่เป็นแรงจริงเบื้องหลังทุกการเคลื่อนไหว เหนือแท่งเทียนเหล่านั้นจะแสดงเมฆไดนามิกที่เปลี่ยนสีตามแนวโน้ม: สีเขียวเมื่อแรงกดดันซื้อมีอำนาจเหนือกว่า สีแดงเมื่อแรงกดดันขายเข้าควบคุม นอกจากนี้ยังวางเส้นระดับสำคัญและสร้างสัญญาณภาพในช่วงเวลาที่ตลาดทะลุระดับเหล่านั้น ชี้ไปยังโอกาสเข้าซื้อที่เป็นไปได้

วิธีใช้? เพิ่มตัวชี้วัดนี้ในกราฟและกรอบเวลาที่ต้องการ ดูสีของเมฆเพื่อเข้าใจแนวโน้มแรงกดดันปัจจุบัน เมื่อมีลูกศรสีเขียวชี้ขึ้นปรากฏ แสดงว่าแรงกดดันซื้อได้ทะลุระดับสำคัญ — โอกาสซื้อที่เป็นไปได้ เมื่อมีลูกศรสีแดงชี้ลงปรากฏ แสดงว่าแรงกดดันขายได้ทะลุระดับสำคัญ — โอกาสขายที่เป็นไปได้ คุณสามารถเปิดหรือปิดสัญญาณแนวโน้มจากการตั้งค่าเพื่อแสดงเฉพาะแท่งเทียนแรงกดดัน สีแท่งเทียนสามารถปรับแต่งได้เต็มที่จากแผงการตั้งค่า

ตลาดที่รองรับ: ฟอเร็กซ์ ดัชนี สินค้าโภคภัณฑ์ สกุลเงินดิจิทัล

ข้อจำกัดความเสี่ยง: ตลาดการเงินมีความเสี่ยงในการสูญเสียเงินทุนโดยเนื้อแท้ ตัวชี้วัดนี้เป็นเครื่องมือวิเคราะห์และไม่รับประกันผลลัพธ์ใดๆ ควรเทรดด้วยเงินทุนที่คุณสามารถเสียได้ และบริหารความเสี่ยงอย่างระมัดระวังในทุกการเทรด

สรุป

สรุปโดย AI
FSP CumulativeDelta is a market pressure indicator designed for use on various financial charts and timeframes. It combines bar-by-bar buying and selling pressure analysis with a trend detection system in a single sub-chart. Instead of displaying price, it visualizes the underlying market force through pressure candles and overlays a dynamic cloud that changes color—green for dominant buying pressure and red for dominant selling pressure. The indicator also plots key level lines and provides visual signals when these levels are broken, indicating potential bullish or bearish opportunities. Users can customize candle colors and toggle trend signals on or off. FSP CumulativeDelta supports multiple markets including Forex, indices, commodities, and cryptocurrencies. It requires tick data for operation and outputs visual trend strength signals to assist in market direction analysis.
โปรไฟล์อินดิเคเตอร์
หมวดหมู่อินดิเคเตอร์
ปริมาณ
ประเภทเอาต์พุต
การแสดงเป็นภาพ
ข้อกำหนดด้านข้อมูล
ข้อมูล Tick
สัญญาณที่รองรับ
ความแข็งแกร่งของแนวโน้ม

การสนทนา

รีวิวจากลูกค้า

0.0
รีวิว: 0
รีวิวจากลูกค้า
ยังไม่มีรีวิวสำหรับผลิตภัณฑ์นี้ หากเคยลองแล้ว ขอเชิญมาเป็นคนแรกที่บอกคนอื่น!

คำถามที่พบบ่อย
Volume
ผลิตภัณฑ์ที่มีให้บริการผ่าน cTrader Store รวมถึงบอทการเทรด อินดิเคเตอร์ และปลั๊กอิน มีให้บริการโดยนักพัฒนาบุคคลที่สามและมีไว้เพื่อวัตถุประสงค์ในการเข้าถึงข้อมูลและทางเทคนิคเท่านั้น cTrader Store ไม่ใช่โบรกเกอร์และไม่ได้ให้คำแนะนำการลงทุน คำแนะนำส่วนบุคคล หรือการรับประกันผลการดำเนินงานในอนาคต

เพิ่มเติมจากผู้เขียนคนนี้

อินดิเคเตอร์
Forex
Crypto
+1
Order block
อินดิเคเตอร์
Forex
NAS100
+3
volumen perfile
อินดิเคเตอร์
Forex
Crypto
+3
FREE Global Trading Sessions Indicator
"Super Ema Candle" โลโก้
ยอดนิยม
4.3
(3)
$25
อินดิเคเตอร์
Forex
Crypto
+2
PREMIUN INDICATOR
อินดิเคเตอร์
Forex
Crypto
+1
Super Arrows
"Perfect Trend" โลโก้
ยอดนิยม
4.5
(4)
$25
อินดิเคเตอร์
Forex
Crypto
+3
Perfect Trend
อินดิเคเตอร์
Forex
Crypto
+2
Daily Fibo
อินดิเคเตอร์
Forex
Crypto
+5
ICT Order Block Advanced
อินดิเคเตอร์
Signal
Bollinger
BB20 MULTICOLOR
อินดิเคเตอร์
Forex
Crypto
+2
HTF Candle
ปลั๊กอินเดสก์ท็อป
Trade Alerts
Quick Switch Toolbar
อินดิเคเตอร์
Supertrend
Moving Average
Easy Trade: Trend & Breakout Indicator for cTrader

นอกจากนี้คุณยังอาจชอบ

อินดิเคเตอร์
Customize your Moving Average! Choose any timeframe and price source for precision and flexibility in your analysis.
อินดิเคเตอร์
ATR
BOS
+5
Market structure with BOS and CHoCH, order blocks, and retest buy/sell arrows with entry, stop and two targets
อินดิเคเตอร์
SMC
VWAP
+16
It calculates Anchored VWAP and StdDev bands from a user-defined start date for cTrader charts.
"Market Structure Shift" โลโก้
เรตติ้งสูง
4.2
(4)
$19
/
$35
อินดิเคเตอร์
Prop
Forex
+11
Market Structure Shift – Professional Market Structure Oscillator
"HLC_Levels" โลโก้
ยอดนิยม
4.5
(4)
$20
/
$25
อินดิเคเตอร์
AI
SMC
+7
The ultimate tool for Price Action and ICT. High, Low and Mid levels for days, weeks Inc. NY Midnight and Custom Range.
อินดิเคเตอร์
Doji
Wedge
+5
Angora Pattern Recognition is a cTrader indicator that finds, draws and tracks classic chart patterns automatically.
อินดิเคเตอร์
ICT ALL KİLL ZONES, LONDON , ASİA, NY AM, NY LUNCH, NY PM
"RangePulsePro" โลโก้
ใหม่
5.0
(1)
$35
อินดิเคเตอร์
Risk Dashboard
AI-powered daily range forecasts help traders spot volatility opportunities and plan stops and targets.
อินดิเคเตอร์
RSI
RSI on the main chart with 45/55 momentum levels, overbought/oversold levels, averaged RSI, and multi-timeframe support.
อินดิเคเตอร์
Forex
Customizable multi-timeframe pivot point indicator for cTrader with alerts, Fibonacci, CPR, and more!
อินดิเคเตอร์
Forex
BTCUSD
+4
This indicator is designed to perform multiple non-linear regression analysis using four independent variables.
"Liquidity Edge" โลโก้
ยอดนิยม
4.4
(5)
$19
/
$29
อินดิเคเตอร์
Imbalance
Inside Bar
+3
A clean and powerful Smart Money Concepts tool combining Fair Value Gaps, Previous Daily High/Low, Inside/Outside bar
อินดิเคเตอร์
SMC
Forex
+5
Pure Price Action ICT Tools
อินดิเคเตอร์
Forex
BTCUSD
+6
All-In-One solution for ICT's FVG IFVG ORDERBLOCK in advanced mode.
อินดิเคเตอร์
ADX
ATR
+2
GOLD SENTINEL v1.0 - A CANDLE-COLORING INDICATOR FOR GOLD.
"AlgoCorner Correlations Map" โลโก้
เรตติ้งสูง
4.7
(4)
$19
/
$30
อินดิเคเตอร์
Forex
EURUSD
+4
Check the correlations between dozens of assets in one elegant display.
"Parabolic RSI Alert  V1" โลโก้
ยอดนิยม
4.7
(4)
$19
อินดิเคเตอร์
Master RSI reversals with Parabolic SAR precision! Get real-time alerts for high-probability trend changes.
"[Stellar Strategies] VBO" โลโก้
เรตติ้งสูง
4.8
(5)
$19
/
$29
อินดิเคเตอร์
Forex
BTCUSD
+11
Next-gen Volume Oscillator using Hyperbolic Tangent math. No repainting. Includes arrows, alerts, and overlay mode 🎯

ราคา

ตั้งแต่ 24/02/2025
18
การขาย
2.21K
ติดตั้งฟรี