
Sample EMA
Gösterge
Sürüm 1.0, Feb 2025
Windows, Mac
Başlangıç 13/02/2025
Açıklama
Özet
AI summary
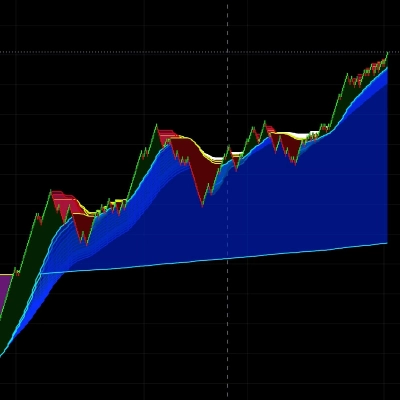
Sample EMA is an indicator for the cTrader (cAlgo) platform that combines the SuperTrend and Moving Average (MA) concepts into a single tool called SuperTrendMA. It calculates a user-selectable type of moving average (default is Exponential) over a specified period (MA Length). It also computes the Average True Range (ATR) over a defined ATR Period and applies an ATR Multiplier to generate SuperTrend bands. Market trends are identified based on price position relative to these bands: an uptrend is signaled when the price closes above the DownTrend Band, and a downtrend when it closes below the UpTrend Band. The indicator visually represents trends with colored lines—lime for uptrend and red for downtrend—and provides trade entry signals using arrows: green arrows indicate a shift from downtrend to uptrend (buy signal), and red arrows indicate a shift from uptrend to downtrend (sell signal). This indicator supports trend analysis and trade signal generation by integrating volatility and moving average data.
Gösterge profili
Müşteri değerlendirmeleri
0.0
Değerlendirmeler: 0
Müşteri değerlendirmeleri
Bu ürün için henüz bir değerlendirme yok. Ürünü denediniz mi? O zaman ona dair görüşlerini paylaşan ilk kişi olun!
Tartışma
SSS
Supertrend
ATR
cTrader Store üzerinden erişilebilen işlem botları, göstergeler ve eklentiler gibi ürünler, üçüncü taraf sağlayıcılar tarafından sağlanır ve yalnızca bilgilendirme ve teknik erişim amaçlarıyla sunulur. cTrader Store bir broker değildir ve yatırım tavsiyesi, kişisel öneriler vermez veya gelecekteki performansı garanti etmez.















Fiyat
Başlangıç 13/02/2025