

present
가입하고 첫 구매 시 $50 할인을 받으세요
Trading product for Apex Break PRO 지표 ADX EMA, image 1
Apex Break PRO
지표
버전 1.0, Sep 2026
Windows, Mac
Trading product for Apex Break PRO 지표 ADX EMA, image 2
Trading product for Apex Break PRO 지표 ADX EMA, image 3
Trading product for Apex Break PRO 지표 ADX EMA, image 4
Trading product for Apex Break PRO 지표 ADX EMA, image 5
Trading product for Apex Break PRO 지표 ADX EMA, image 6
Trading product for Apex Break PRO 지표 ADX EMA, image 7
Trading product for Apex Break PRO 지표 ADX EMA, image 8
Trading product for Apex Break PRO 지표 ADX EMA, image 9
Trading product for Apex Break PRO 지표 ADX EMA, image 10
Trading product for Apex Break PRO 지표 ADX EMA, image 11

설명

Apex Break PRO draws the trendlines that matter and scores every break of them.

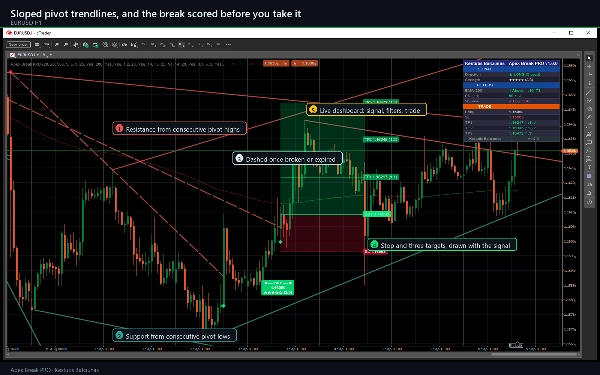
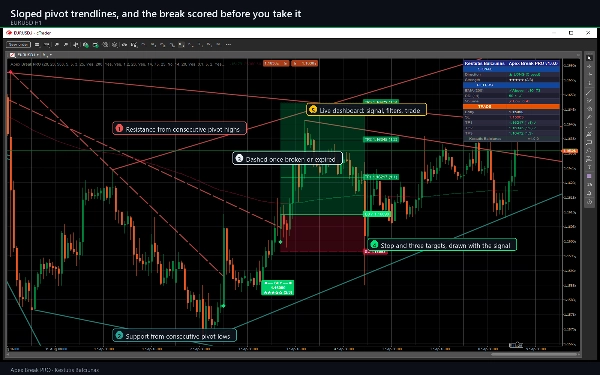
Consecutive pivot highs form a sloped resistance line, consecutive pivot lows a sloped support line. These are not horizontal levels: they follow the market's own direction and they expire. A signal appears when the close of a CONFIRMED bar clears one of those lines by a margin measured in ATR, and only when enough independent filters agree.

What it draws on your chart

  • Sloped resistance and support trendlines, up to five of each, solid while they are live and dashed once they are broken or have run out their extension.
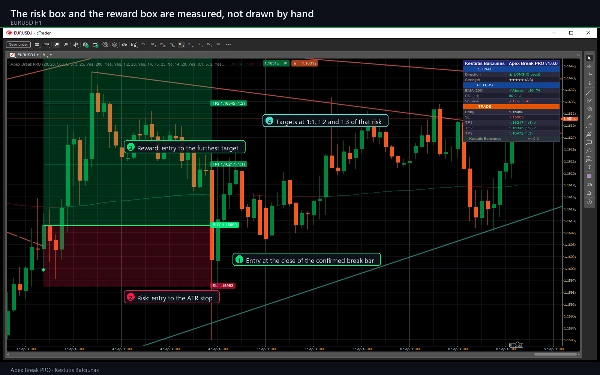
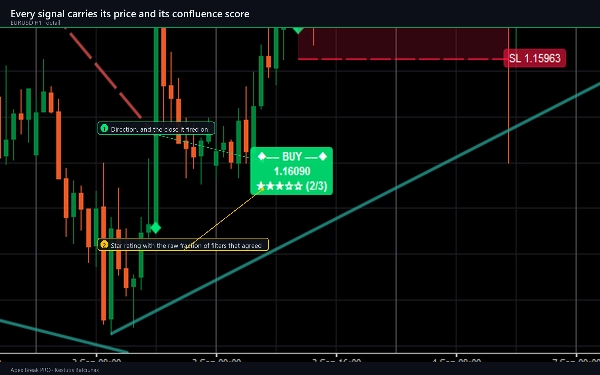
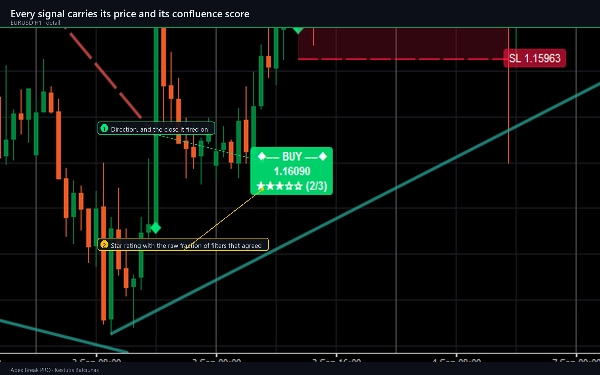
  • A BUY or SELL marker with a label carrying the price, a five-star rating and the confluence fraction, for example 3/4.
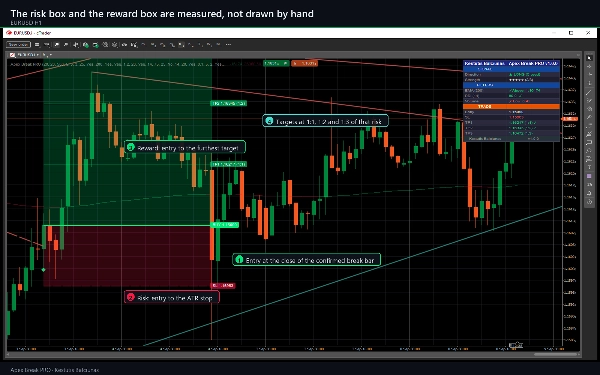
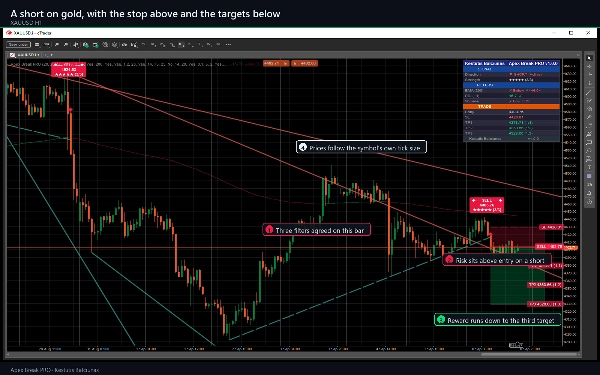
  • The stop, at 1.5 x ATR by default, and three targets at 1:1, 1:2 and 1:3 of that distance, with a shaded risk zone and a shaded reward zone.
  • The 200 EMA, coloured by which side of it price is trading.
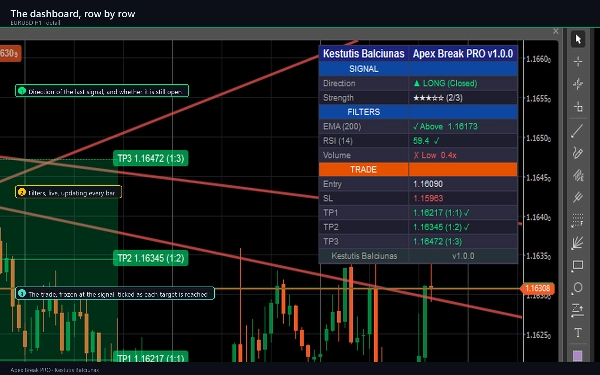
  • A two-column dashboard with a SIGNAL section, a live FILTERS section and a TRADE section that marks each target as it is reached.

How to trade with it

  1. Give it history. On the default settings it needs about 250 bars before the first line appears, because the 200 EMA has to seed and a pivot is only confirmed 20 bars after it forms.
  2. Wait for a marker. The break is evaluated on a closed bar, so the marker does not move once it is printed.
  3. Read the star rating and the FILTERS rows before you act. The score says how many of the enabled conditions agreed on that bar. It is a description of agreement, not a probability.
  4. Use the drawn stop and targets as they are, or as a template for your own sizing.
  5. Watch the TRADE rows. Each target is marked as price reaches it, and tracking stops at the stop or the third target.
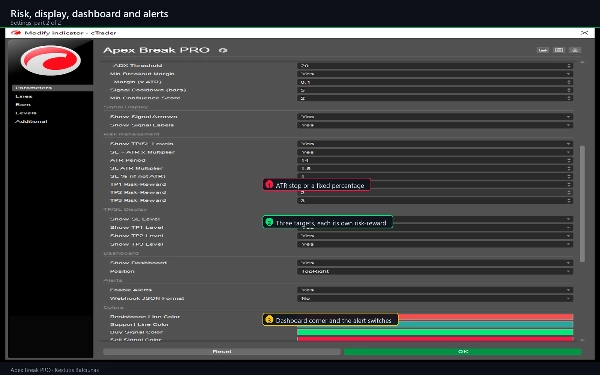
  6. Turn on the alerts you want. Nine separate events are available.

Key settings

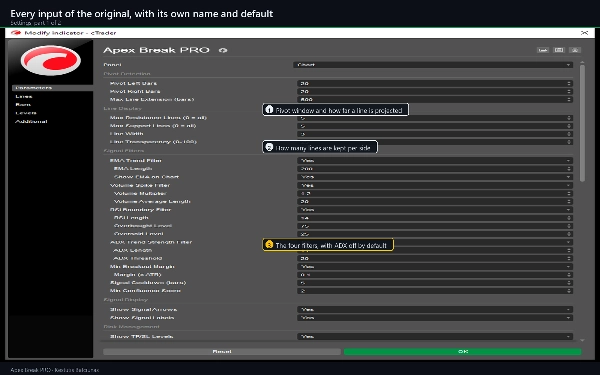
  • Pivot Detection: left and right bars, both 20, and a maximum line extension of 500 bars.
  • Line Display: up to 5 resistance and 5 support lines, width 3, transparency 25.
  • Signal Filters: EMA 200; RSI 14 with 75 and 25 boundaries; volume 1.2x its 20-bar average; ADX 14 above 20, off by default; a breakout margin of 0.1 x ATR; a 5-bar cooldown; a minimum score of 2.
  • Risk Management: ATR 14, stop at 1.5 x ATR or a fixed percentage, targets at 1:1, 1:2 and 1:3.
  • Dashboard in six positions, nine alert toggles, and the four line and signal colours.

65 parameters in total, across pivot detection, line display, the signal filters, risk management, the TP/SL display, the dashboard, nine alert toggles with their delivery channels, and the colours.

Indicator type, periods, instruments, use cases

A support-and-resistance, trend and volatility indicator that draws on the main chart and emits signals. It runs on any symbol and any timeframe. M15, H1 and H4 are the window it was designed around; lower periods give more signals with tighter ATR stops, D1 and above give fewer and wider ones. The volume filter is used where your broker supplies volume and can be switched off where it does not. Typical uses: trendline-break entries with a stated confluence, ATR-based stop placement, staged exits at 1:1, 1:2 and 1:3, higher-timeframe confirmation, and feeding a cBot from the hidden signal output.

Who it is for

Traders who already draw trendlines by hand and want them drawn the same way on every chart, every time, with the break scored before they act on it. It is an analysis tool: it never places, modifies or closes an order, and it has no access to your account.

Trial: what the full version adds

The trial is this same build, limited to EURUSD, with no time limit and every parameter available. On any other symbol it shows a notice instead of drawing. The full version removes the symbol lock: every forex pair, index, metal, energy and crypto symbol your broker offers.

Technical notes and limitations

  • Signals are evaluated on closed bars and do not repaint. A pivot is confirmed only after Pivot Right Bars have formed, and that confirmation lag is the price of not repainting. The trendlines themselves are provisional on the bar still forming.
  • Alerts fire only for bars that close after you attach the indicator, never for history.
  • The marks on the target rows record that price later touched a drawn level on the history in your chart. They are not trade results: no spread, commission, swap, slippage or fill is involved, and no statistic is derived from them.
  • The chart keeps the most recent signal labels and trendlines and prunes the oldest.
  • Two brokers do not have identical candles, so signals on a live chart will differ from the same indicator on another feed. That is a data difference, not a difference in the calculation.
  • Requirements: cTrader 5.0 or newer, tested on 5.9. Access Rights: None - no file, network or trading access.

Support

Questions through the Discussion tab of this page or Ask seller. Updates are free and listed in the version history. The Store provides a 14-day money-back period. If the indicator works for you, a rating helps other traders find it.

Trading involves risk. Past performance does not guarantee future results.

요약

지표 프로필
지표 카테고리
추세
출력 유형
신호
데이터 요구 사항
막대만
지원되는 신호
돌파
레벨 돌파

고객 리뷰

0.0
리뷰: 0
고객 리뷰
이 상품에 대한 리뷰가 아직 없습니다. 이미 사용해 보셨나요? 다른 사람들에게 가장 먼저 소개해 주세요!

상담

자주 묻는 질문(FAQ)

ADX
EMA
Key Levels
RSI
Volume
ATR
Support & Resistance
트레이딩 봇, 지표, 플러그인 등 cTrader Store에서 제공되는 상품은 제3자 개발자에 의해 제공되며, 이는 단순히 정보 및 기술적 접근을 목적으로 제공된 것입니다. cTrader Store는 중개인이 아니며, 투자 조언, 개인별 추천 또는 향후 성과에 대한 어떠한 보장도 제공하지 않습니다.

이 작성자의 상품 더 보기

지표
ATR
BOS
+5
Know how strong each Supertrend flip is: scored BUY/SELL, structure stop + 3 targets, live win-rate dashboard, alerts.
지표
ATR
RSI
+5
Supply and demand zones with break of structure, higher timeframe MA signals, a percent stop and three targets.
지표
ATR
Volume
+3
Fibonacci trend signals on closed bars, with an ATR stop, up to four targets and a break-even ladder.
지표
ADX
ATR
+5
Ten confluence layers scored on every closed bar, with an anti-chop gate, pivot levels and a live dashboard.
지표
Volume
Channel
+3
A higher-timeframe log-regression channel with a volume profile, Point of Control and session levels.
지표
Volume
Key Levels
+1
Fixed-grid volume profile: bull and bear volume at every price level, with Point of Control and value area.
지표
ADX
ATR
+5
SuperTrend signals scored on five confluence factors, with an ATR stop, three targets and a dashboard.

좋아하실 만한 다른 항목

지표
ATR
EMA
+4
SCALPING M1 CTRADER v1.0 — Institutional-Grade M1 Gold & Forex Scalping System
지표
ZigZag
Indices
+2
Auto Trendlines, Fibonacci, Pitchfork and Patterns from non‑repainting pivots. One‑click Presets, targeted Alerts, and a
지표
Prop
Forex
+13
Identifies market compression zones and explosive Breakout moments using mathematical modeling.
지표
AI
ATR
+27
Overbought Oversold Indicator
지표
ATR
The Tenkan-ATR Indicator is a powerful and innovative indicator for Traders. SALE OFF!!!
지표
ATR
RSI
+6
🔍 MultiScalpScorePRO – Powerful real-time scoring system combining indicators for ultra-precise scalping signals.
지표
AI
SMC
+5
Complete ICT Killzones: 5 sessions, easy colors, transparency controls & session info. Professional timing for cTrader.
지표
SMC
Forex
+5
Pure Price Action ICT Tools
지표
Pin Bar
Inducement
+5
Institutional Nasdaq Session Liquidity Map with Live Point HUD, Sweep Alerts & Interactive Playbook.
지표
Indices
Multi-Timeframe ADX Trend Dots & Arrows
지표
Volume
Channel
+3
A higher-timeframe log-regression channel with a volume profile, Point of Control and session levels.
지표
Forex
BTCUSD
+5
Simple ICT Concepts
지표
Volume
Key Levels
+2
Support and resistance from a rolling volume profile, ranked by strength or recency, updated live.
지표
SMC
Prop
+7
institutional-level market analysis
"heatmap kopie" 로고
최고 평점
4.2
(4)
$19
/
$29
지표
AI
SMC
+13
Dynamic Liquidity Depth exposes hidden volume
지표
AI
BOS
+4
Golden Boom and Crash Spike Detector is a trading tool designed for Crash 300 and Boom 300 indices on M1 Timeframe.
지표
Forex
BTCUSD
+8
The traditional Hull Moving Average with different colours based on the slope (direction) of the trend.
지표
ADX
ATR
+5
Ten confluence layers scored on every closed bar, with an anti-chop gate, pivot levels and a live dashboard.

가격




























