Jika anda pernah meluangkan masa dalam pasaran Forex, anda tahu betapa sukarnya untuk mengetahui mata wang mana yang benar-benar memacu pergerakan, terutamanya apabila anda melihat pelbagai pasangan. Saya sering mendapati diri saya ingin cara yang lebih jelas untuk melihat prestasi individu mata wang utama, bukan hanya bagaimana satu pasangan berkelakuan.
Itulah sebabnya saya membangunkan penunjuk Kekuatan Mata Wang Relatif ini.
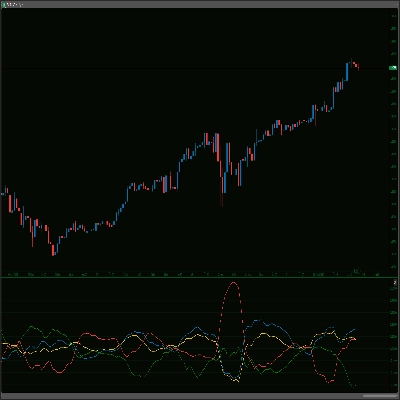
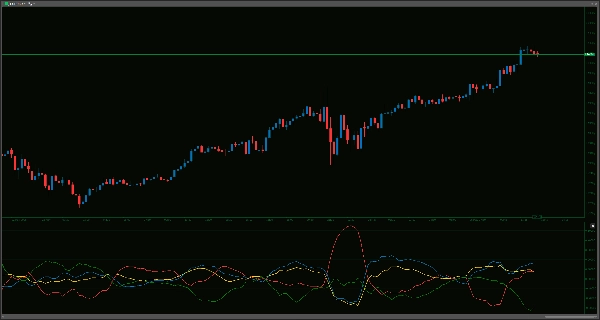
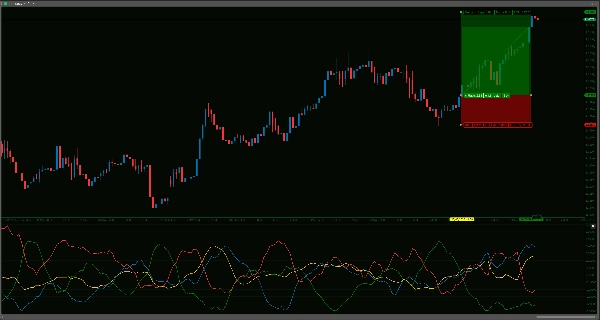
Idenya agak mudah: ia bertujuan untuk mengukur dan memaparkan kekuatan relatif AUD, USD, EUR, dan JPY. Ia melakukan ini dengan melihat bagaimana setiap mata wang ini berprestasi berbanding dengan bakul mata wang lain (khususnya merentasi pasangan seperti AUDUSD, AUDEUR, AUDJPY, EURUSD, EURJPY, dan USDJPY) sepanjang tempoh tinjauan yang anda boleh tentukan.
Bagaimana saya mendapati ia berguna, dan bagaimana ia mungkin membantu anda:
- Pemilihan Pasangan yang Lebih Baik: Kadang-kadang, melihat bahawa, contohnya, AUD sentiasa menguat manakala JPY melemah boleh memberi anda dorongan untuk melihat lebih dekat pada AUD/JPY. Ia boleh membantu menapis pasangan yang anda fokuskan.
- Memahami Pemacu Pasaran: Apabila pasangan seperti EUR/USD bergerak, adakah ia kebanyakannya kekuatan USD atau kelemahan EUR? Penunjuk ini boleh memberi anda perspektif tentang itu, membantu anda memahami aliran yang lebih luas.
- Sesuaikan dengan Gaya Anda:
-
- Anda boleh laraskan
LookbackPeriod(lalai adalah 14 bar). Tempoh yang lebih pendek akan lebih responsif, tempoh yang lebih panjang akan menunjukkan trend yang lebih mantap. - Terdapat juga
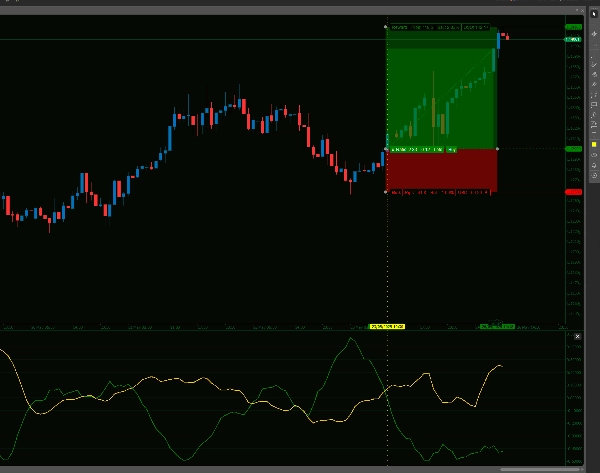
SmoothingPeriod(lalai adalah 5 bar) yang menggunakan EMA pada garis kekuatan. Ini boleh membantu mengurangkan sebahagian bunyi jika anda lebih suka output yang lebih lancar. Jika anda mahu pengiraan mentah, tetapkan smoothing kepada 0.
- Anda boleh laraskan
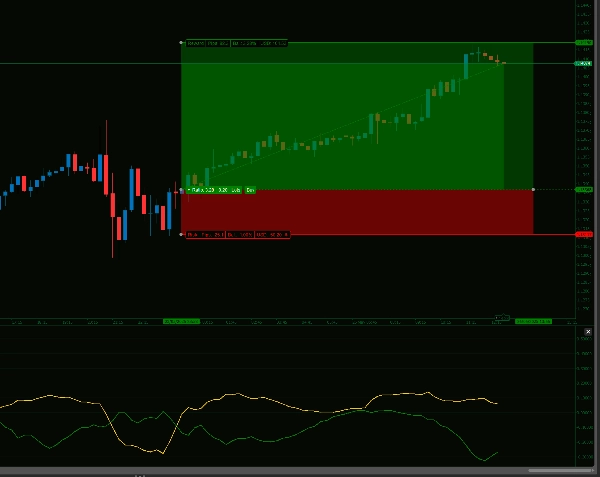
- Visual yang Jelas: Ia melukis kekuatan setiap mata wang sebagai garis berasingan dalam tetingkap sendiri di bawah carta utama anda, jadi ia tidak mengacaukan tindakan harga anda.
- Data yang Boleh Dipercayai: Pengiraan dilakukan pada penutupan setiap bar, jadi garis tidak akan diubah atau berubah setelah bar selesai.
Tiada penunjuk yang boleh meramalkan segalanya, dan yang ini tidak berbeza. Ia adalah alat. Saya mendapati ia menjadi sebahagian berguna dalam proses analisis saya, terutamanya untuk mengesahkan idea atau mendapatkan gambaran cepat tentang apa yang dilakukan oleh mata wang utama.
Berhati-hati, memandangkan penunjuk ini menarik data untuk semua pasangan mata wang untuk mengira kekuatan relatif sebenar dengan berkesan, penunjuk ini boleh menggunakan banyak sumber dan kadang-kadang boleh menyebabkan Ctrader tergendala jika anda mempunyai penunjuk lain yang juga menggunakan banyak sumber. Saya pernah mengalami ini sekali dalam bulan lepas pada PC saya yang berusia 5 tahun jadi ia tidak sepatutnya berlaku secara kerap. Tetapi jika ia berlaku, penyegaran mudah pada jangka masa tetingkap atau pelarasan mudah pada tetapan tempoh sebanyak +/-1 akan memaksa pengiraan semula dan penunjuk akan muncul semula.
--------------------------
Sila lihat penunjuk saya yang lain!
https://ctrader.com/products/1181
https://ctrader.com/products/1182
https://ctrader.com/products/1180
https://ctrader.com/products/1015
https://ctrader.com/products/555
https://ctrader.com/products/553
https://ctrader.com/products/554
https://ctrader.com/products/552
https://ctrader.com/products/557
https://ctrader.com/products/845
https://ctrader.com/products/848
https://ctrader.com/products/847
https://ctrader.com/products/846
https://ctrader.com/products/551
https://ctrader.com/products/574
https://ctrader.com/products/573
https://ctrader.com/products/556
https://ctrader.com/products/558
5 | 67 % | |
4 | 33 % | |
3 | 0 % | |
2 | 0 % | |
1 | 0 % |


