ถ้าคุณเคยใช้เวลาบนตลาด Forex คุณจะรู้ว่ามันยากแค่ไหนที่จะหาว่าสกุลเงินใดเป็นตัวขับเคลื่อนการเคลื่อนไหวอย่างแท้จริง โดยเฉพาะเมื่อคุณดูหลายคู่สกุลเงิน ฉันมักจะต้องการวิธีที่ชัดเจนกว่าในการดูประสิทธิภาพของสกุลเงินหลักแต่ละสกุล ไม่ใช่แค่ดูว่าคู่สกุลเงินใดคู่หนึ่งทำงานอย่างไร
นั่นคือเหตุผลที่ฉันพัฒนา ตัวชี้วัด Relative Currency Strength นี้ขึ้นมา
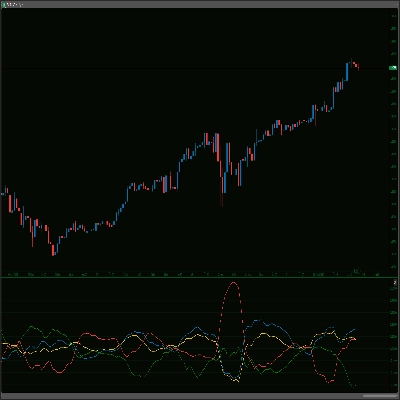
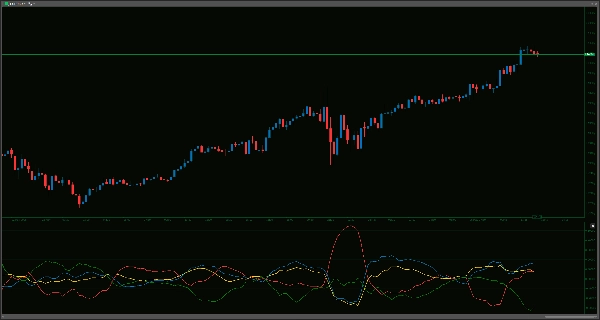
แนวคิดค่อนข้างตรงไปตรงมา: มันมีเป้าหมายเพื่อวัดและแสดงความแข็งแกร่งสัมพัทธ์ของ AUD, USD, EUR และ JPY โดยดูว่าทั้งสกุลเงินเหล่านี้ทำงานอย่างไรเมื่อเทียบกับตะกร้าของสกุลเงินอื่น ๆ (โดยเฉพาะในคู่สกุลเงินเช่น AUDUSD, AUDEUR, AUDJPY, EURUSD, EURJPY และ USDJPY) ในช่วงเวลาย้อนหลังที่คุณสามารถกำหนดได้
วิธีที่ฉันพบว่ามันช่วยได้ และวิธีที่มันอาจช่วยคุณ:
- การเลือกคู่สกุลเงินที่ดีขึ้น: บางครั้ง การเห็นว่า AUD แข็งแกร่งขึ้นอย่างต่อเนื่องในขณะที่ JPY อ่อนตัวลง อาจช่วยกระตุ้นให้คุณดูคู่ AUD/JPY อย่างใกล้ชิดมากขึ้น มันช่วยกรองคู่สกุลเงินที่คุณควรให้ความสนใจ
- เข้าใจตัวขับเคลื่อนตลาด: เมื่อคู่สกุลเงินอย่าง EUR/USD เคลื่อนไหว มันเป็นเพราะความแข็งแกร่งของ USD หรือความอ่อนแอของ EUR เป็นหลัก? ตัวชี้วัดนี้สามารถให้มุมมองในเรื่องนั้น ช่วยให้คุณเข้าใจการไหลโดยรวมได้ดีขึ้น
- ปรับให้เหมาะกับสไตล์ของคุณ:
-
- คุณสามารถปรับ
LookbackPeriod(ค่าเริ่มต้นคือ 14 แท่ง) ช่วงเวลาที่สั้นกว่าจะตอบสนองได้เร็วกว่า ช่วงเวลาที่ยาวกว่าจะโชว์แนวโน้มที่ชัดเจนกว่า - นอกจากนี้ยังมี
SmoothingPeriod(ค่าเริ่มต้นคือ 5 แท่ง) ซึ่งใช้ EMA กับเส้นความแข็งแกร่ง ช่วยลดเสียงรบกวนถ้าคุณต้องการผลลัพธ์ที่เรียบขึ้น หากคุณต้องการการคำนวณดิบ ๆ ให้ตั้งค่า smoothing เป็น 0
- คุณสามารถปรับ
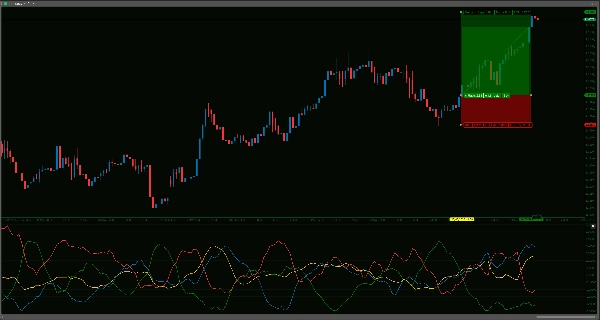
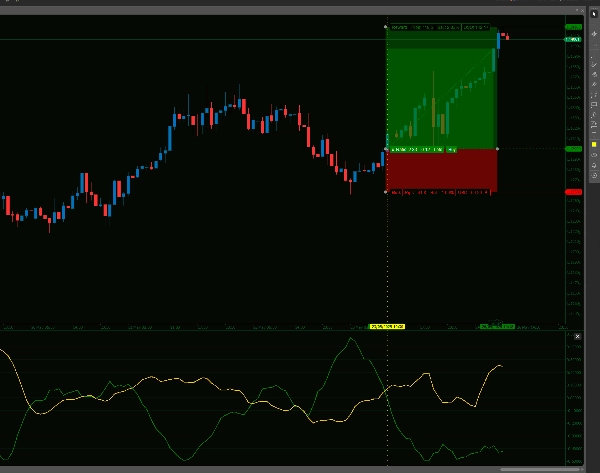
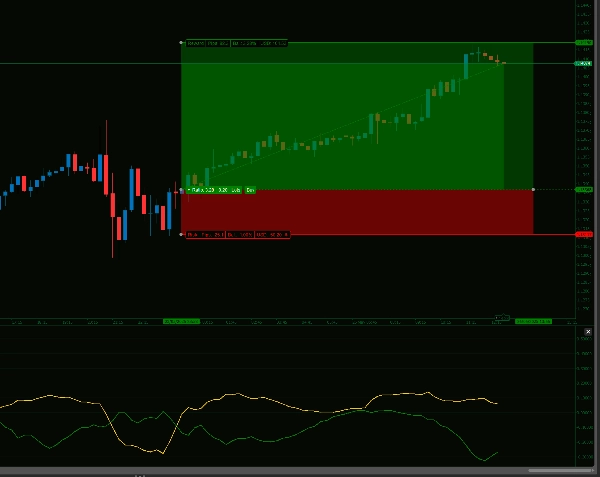
- ภาพที่ชัดเจน: มันแสดงเส้นความแข็งแกร่งของแต่ละสกุลเงินเป็นเส้นแยกในหน้าต่างของตัวเองใต้กราฟหลักของคุณ ดังนั้นจึงไม่ทำให้กราฟราคาของคุณรก
- ข้อมูลที่เชื่อถือได้: การคำนวณทำบนราคาปิดของแต่ละแท่ง ดังนั้นเส้นจะไม่ถูกวาดซ้ำหรือเปลี่ยนแปลงเมื่อแท่งเสร็จสมบูรณ์แล้ว
ไม่มีตัวชี้วัดใดที่เป็นลูกแก้วทำนายอนาคต และตัวนี้ก็ไม่ต่างกัน มันเป็นเครื่องมือ ฉันพบว่ามันเป็นส่วนที่มีประโยชน์ในกระบวนการวิเคราะห์ของฉัน โดยเฉพาะอย่างยิ่งสำหรับการยืนยันไอเดียหรือการดูภาพรวมอย่างรวดเร็วว่าสกุลเงินหลักกำลังทำอะไรอยู่
แจ้งให้ทราบว่า เนื่องจากตัวชี้วัดนี้ดึงข้อมูลจากทุกคู่สกุลเงินเพื่อคำนวณความแข็งแกร่งสัมพัทธ์ที่แท้จริง ตัวชี้วัดนี้อาจใช้ทรัพยากรเครื่องมากและทำให้ Ctrader ค้างได้ในบางครั้งหากคุณมีตัวชี้วัดที่ใช้ทรัพยากรหนักอื่น ๆ ด้วย ฉันเคยเจอเหตุการณ์นี้ครั้งหนึ่งในเดือนที่ผ่านมาในคอมพิวเตอร์อายุ 5 ปีของฉัน ดังนั้นไม่ควรเกิดขึ้นบ่อยครั้ง แต่ถ้าเกิดขึ้น การรีเฟรชหน้าต่างช่วงเวลาหรือปรับค่าช่วงเวลาเพิ่มหรือลด 1 จะบังคับให้คำนวณใหม่และตัวชี้วัดจะปรากฏขึ้นอีกครั้ง
--------------------------
โปรดตรวจสอบตัวชี้วัดอื่น ๆ ของฉันได้เลย!
https://ctrader.com/products/1181
https://ctrader.com/products/1182
https://ctrader.com/products/1180
https://ctrader.com/products/1015
https://ctrader.com/products/555
https://ctrader.com/products/553
https://ctrader.com/products/554
https://ctrader.com/products/552
https://ctrader.com/products/557
https://ctrader.com/products/845
https://ctrader.com/products/848
https://ctrader.com/products/847
https://ctrader.com/products/846
https://ctrader.com/products/551
https://ctrader.com/products/574
https://ctrader.com/products/573
https://ctrader.com/products/556
https://ctrader.com/products/558
5 | 67 % | |
4 | 33 % | |
3 | 0 % | |
2 | 0 % | |
1 | 0 % |


