


Açıklama
Genel Bakış
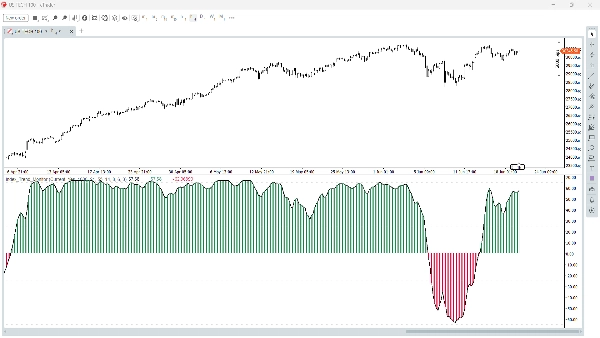
cTrader için Index Trend Monitor, özellikle US100 gibi endeks CFD'leri için tasarlanmış temiz bir trend gücü göstergesidir.
EMA yapısı, ATR normalizasyonu, impuls analizi ve süreklilik mantığını, kolayca okunabilen kompakt bir skorda birleştirir.
Amacı basittir: Tüccarların piyasanın anlamlı bir yükseliş veya düşüş baskısı gösterip göstermediğini ya da momentumu güvenilir olmayacak kadar zayıf olup olmadığını hızlıca değerlendirmelerine yardımcı olmak.
Bu gösterge neyi gösterir
- Genel yönsel baskı için Trend Skoru çizgisi
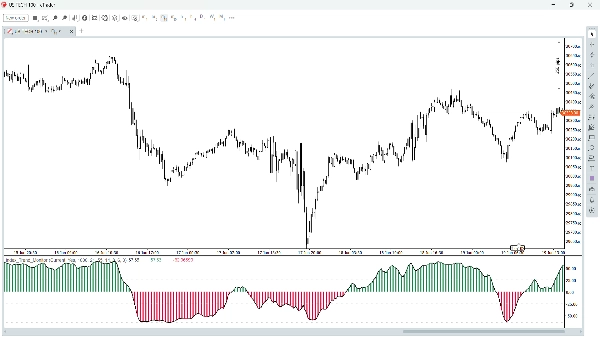
- Boğa Gücü histogramı
- Ayı Gücü histogramı
- Piyasa durumunun hızlı yorumlanması için Rejim Kodu çıktısı
Ana özellikler
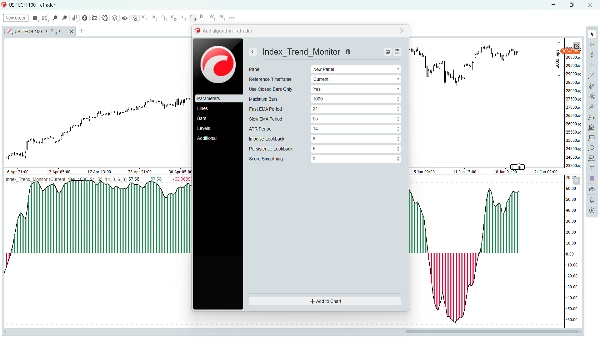
- Referans zaman dilimi desteği
- Daha stabil okumalar için sadece kapanış barı modu
- Temiz ayrı pencere düzeni
- Aktif endeks piyasaları için hızlı görsel okuma
Nasıl yorumlanır
- Artan pozitif değerler güçlenen boğa baskısını gösterir
- Azalan negatif değerler güçlenen ayı baskısını gösterir
- Zayıf veya yatay okumalar düşük kararlılık koşullarını gösterebilir
- Histogram yönsel gücü hızlıca görselleştirmeye yardımcı olur
Tipik kullanım durumları
- İşlemlere girmeden önce zayıf piyasa koşullarını filtrelemek
- US100 ve diğer aktif endeks CFD'lerinde yönsel eğilimi doğrulamak
- Manuel işlem akışına hızlı bir trend gücü katmanı eklemek
- Momentumun genişleyip genişlemediğini veya azaldığını kontrol etmek
Kimler için uygundur
Bu gösterge, grafik üzerinde aşırı yükleme olmadan basit ve okunabilir bir piyasa gücü aracı isteyen tüccarlar için uygundur.
Özellikle hızlı hareket eden endeks ürünlerine odaklanan tüccarlar için faydalıdır.
Önemli not
Bu, pratik bir trend filtresi olarak tasarlanmış ücretsiz bir cTrader sürümüdür. Tam bir işlem planı veya risk yönetimi sürecinin yerine geçmek değil, karar vermeyi desteklemek amaçlanmıştır.
Özet
Key features include support for reference timeframes, a closed-bar-only mode for stable readings, and a clean separate-window layout optimized for fast visual assessment of index market momentum. Rising positive values indicate strengthening bullish pressure, while falling negative values suggest increasing bearish pressure. Flat or weak readings may signal low-conviction market conditions.
Typical use cases involve filtering weak market conditions before trade entries, confirming directional bias on US100 and other index CFDs, adding a trend-strength layer to manual trading workflows, and monitoring momentum expansion or fading. This indicator is suitable for traders seeking a straightforward market-strength tool without cluttering charts, especially those focused on fast-moving index products. It serves as a practical trend filter to support decision-making within a broader trading plan.
Tartışma
Müşteri değerlendirmeleri
5 | 100 % | |
4 | 0 % | |
3 | 0 % | |
2 | 0 % | |
1 | 0 % |
SSS
Bu oluşturanın diğer ürünleri

















Fiyat