Indicator
NAS100
NZDUSD
XAUUSD
Commodities
Forex
Signal
EURUSD
MACD
GBPUSD
BTCUSD
Indices
Prop
Stocks
Supertrend
Crypto
USDJPY
Scalping
MacD Custom Indicator Multi Time Frame
17/10/2025
3
Desktop
Since 04/05/2025
Sales
15
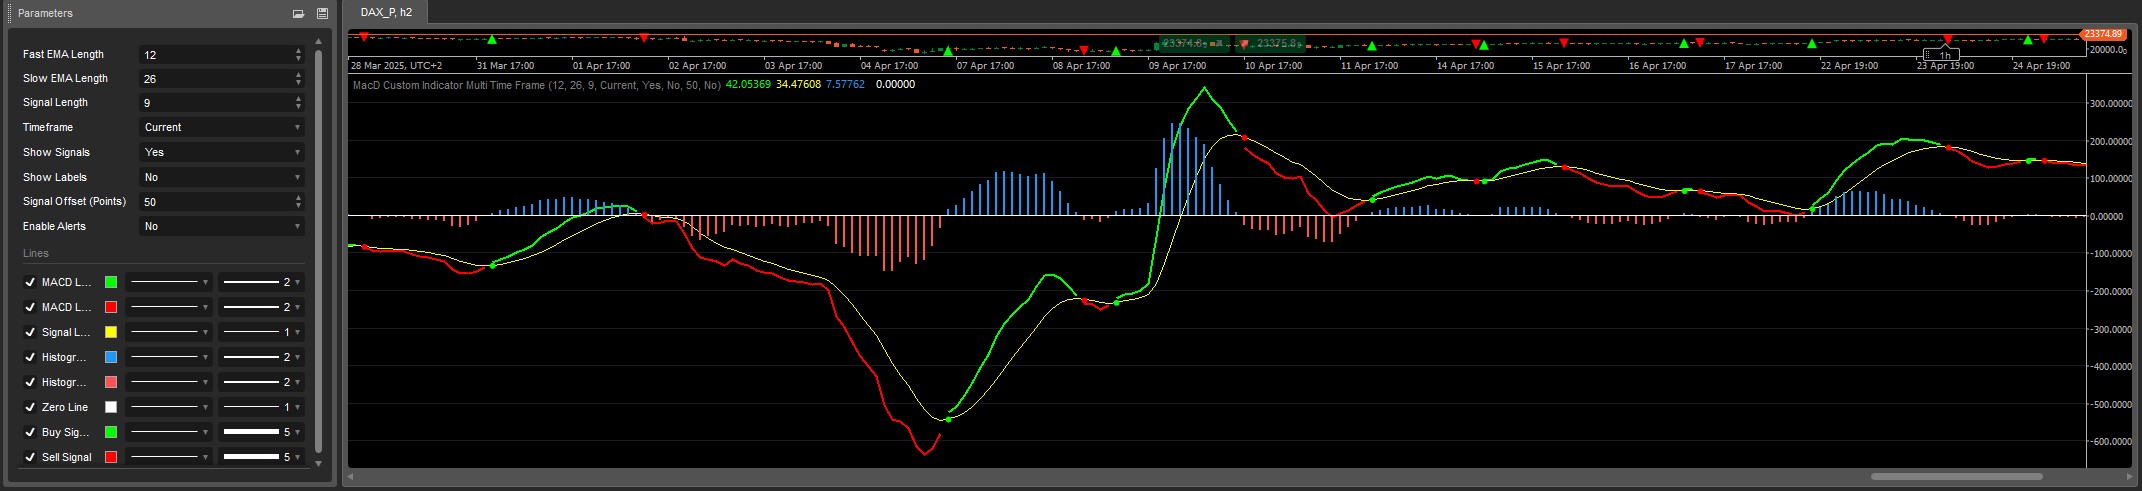
MACD Custom MTF (Multiple Time Frame) is an advanced tool that fuses the proven power of the classic MACD with the critical edge of multi-timeframe analysis and modern, intuitive visualization. Designed for discerning traders who demand precision, rapid interpretation, and the ability to tailor tools to their unique strategy.
Why is our MACD Custom MTF a Game-Changer?
- Multi-Timeframe (MTF) Analysis on a Single Chart:
- Stop the chart-juggling! Display MACD data from a higher timeframe (e.g., H1, H4, D1) directly onto your current working chart (e.g., M5, M15).
- Gain invaluable broader market context, identify dominant underlying trends, and effectively filter out misleading noise from lower timeframes.
- Fully configurable – choose from a comprehensive list of timeframes, from minutes to monthly.
- Dynamic MACD & Signal Line Coloring:
- Instant trend confirmation: The MACD line dynamically changes color (e.g., green/red or your chosen scheme) upon crossing its signal line, vividly illustrating bullish or bearish momentum.
- No more guesswork – the line color immediately tells you if the MACD is above (bullish) or below (bearish) its signal.
- Crystal-Clear Histogram with Enhanced Color Options:
- Visualizes the divergence (strength) between the MACD and its signal line.
- cTrader Version: Intuitively colors bars based on whether they are positive (e.g., blue) or negative (e.g., red).
- PineScript Version (TradingView): Offers sophisticated 4-color histogram coding, which not only shows position relative to the zero line but also the direction of change (increasing/decreasing), providing even deeper insight into momentum shifts.
- Unmistakable Visual Crossover Signals:
- Never miss a critical crossover again! The indicator automatically highlights MACD/Signal line crosses.
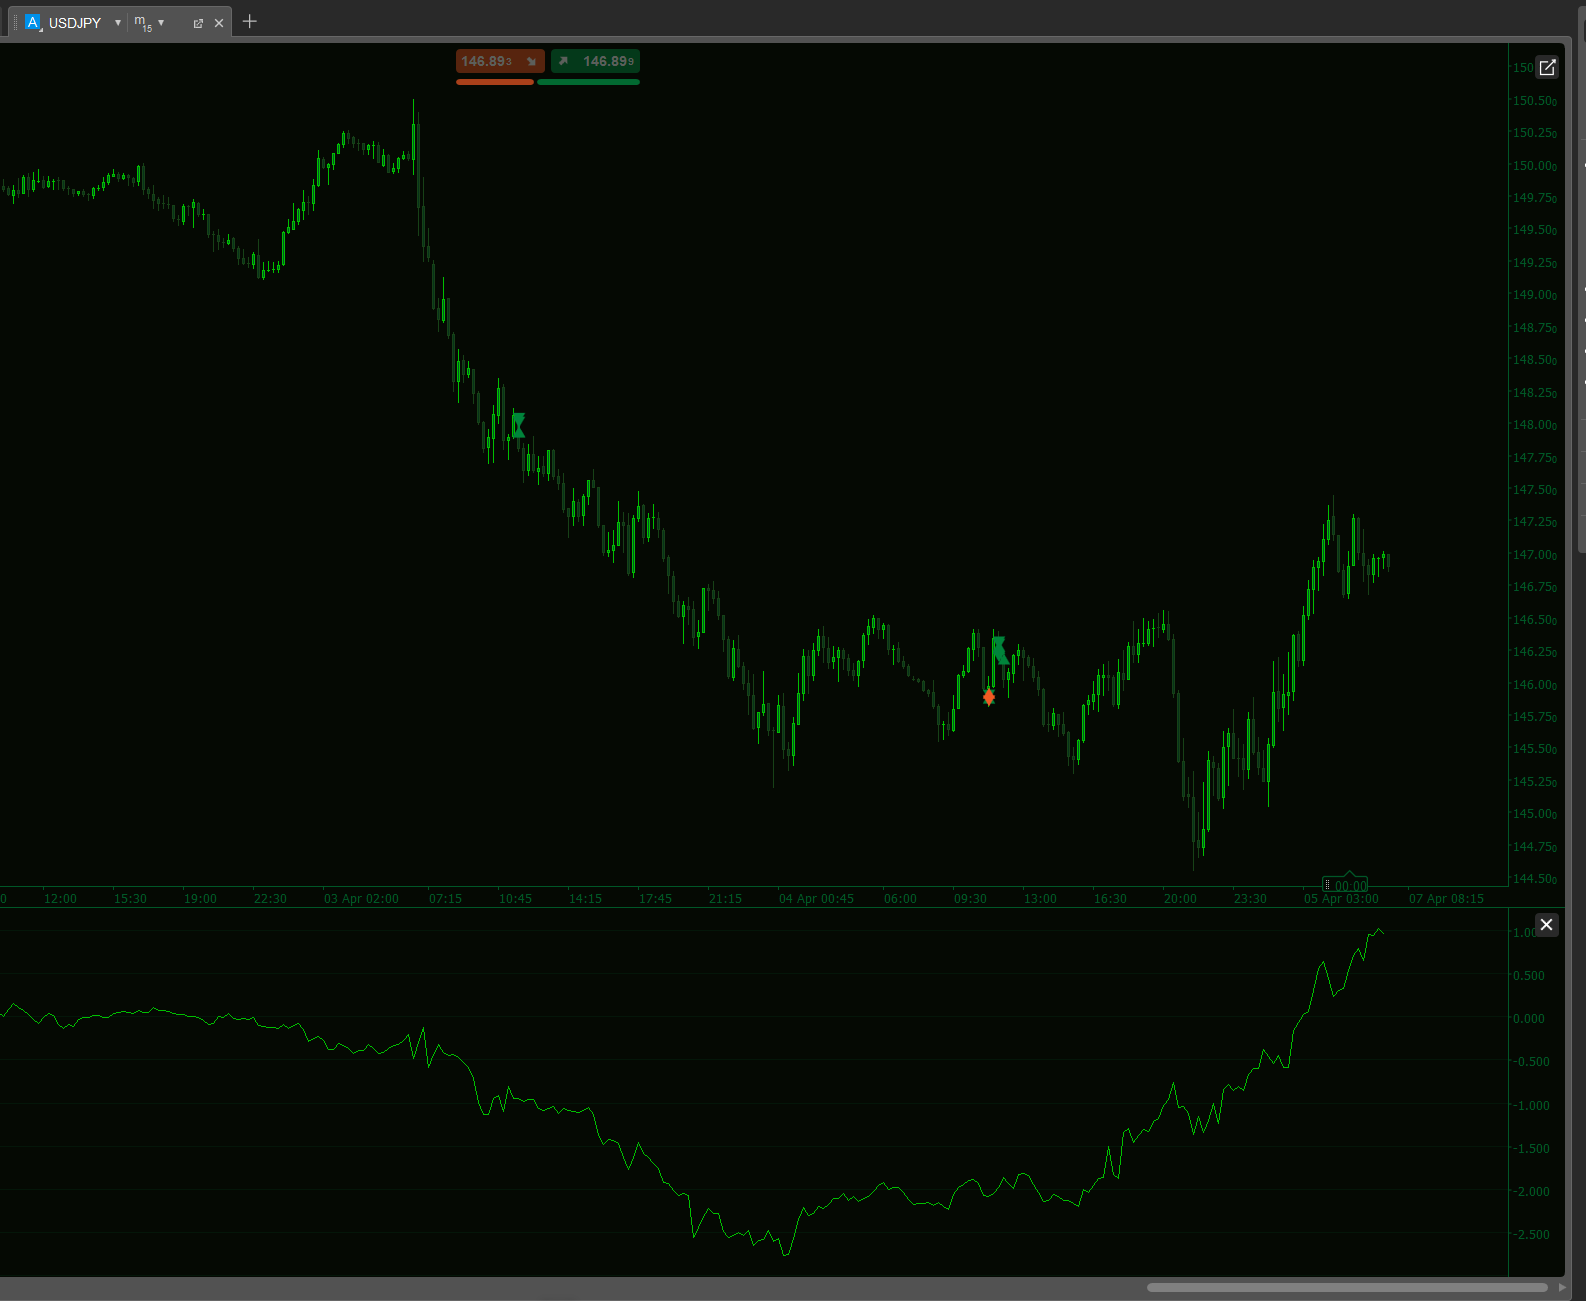
- cTrader Version: Plots distinct arrows or points directly on your price chart (with optional offset) and offers optional "Buy"/"Sell" text labels for ultimate clarity.
- PineScript Version (TradingView): Displays clean, easy-to-spot dots on the signal line at the exact point of crossover.
- Integrated Alerts (Platform-Specific Functionality):
- cTrader Version: Features built-in sound and email alert notifications for buy/sell signals. Stay informed of every opportunity, even when you're not glued to your screen!
- PineScript Version (TradingView): Easily configure alerts using TradingView's powerful built-in alert system based on crossover conditions.
- Full Customization at Your Fingertips:
- Tailor Fast EMA, Slow EMA, and Signal Line lengths to your precise specifications.
- Toggle visibility for individual visual elements: MACD & Signal lines, Histogram, Crossover Signals, Labels.
- Customize colors and line thickness to perfectly match your chart aesthetics and preferences.
0.0
Reviews: 0
Customer reviews
No reviews for this product yet. Already tried it? Be the first to tell others!
More from this author


You may also like