

[Fx4U] Multi Trend Line Indicator
Indicator
Version 1.0, Oct 2024
Windows, Mac

11.64M
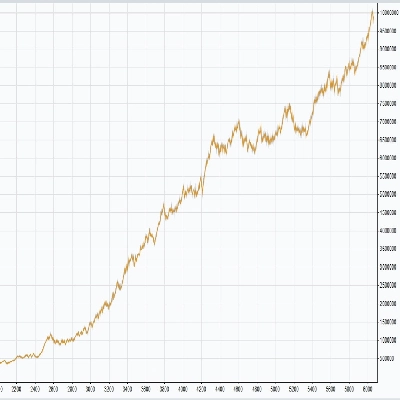
Traded volume
165.2K
Pips won
56
Sales
5.05K
Free installs
Description
Summary
AI summary
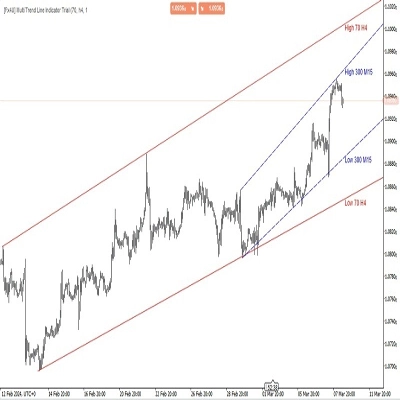
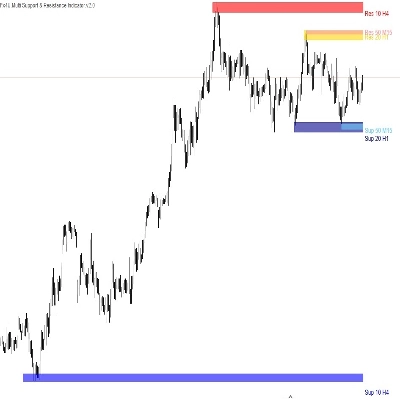
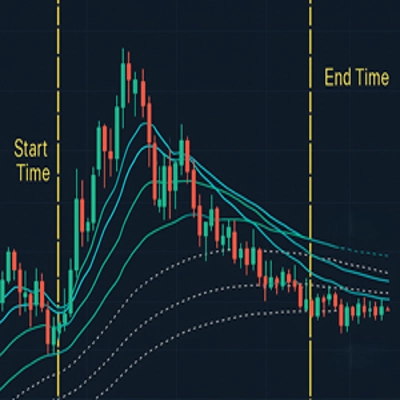
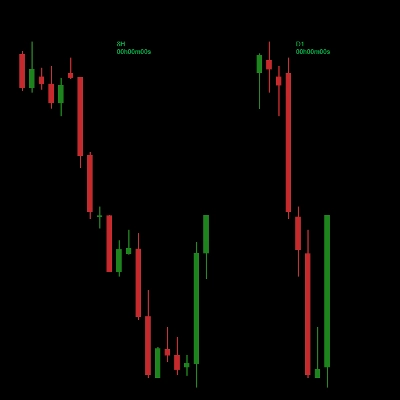
[Fx4U] Multi Trend Line Indicator is a technical analysis tool designed to identify and visualize market trends by drawing trendlines on price charts. It connects two or more price points to indicate the direction and strength of trends over time. This indicator supports multiple timeframes, allowing traders to analyze trends across various periods simultaneously. Users can customize the timeframes to plot trendlines that highlight key support and resistance levels, trend reversals, and continuations. The indicator distinguishes between upward trendlines (connecting successive lows), downward trendlines (connecting successive highs), and horizontal trendlines (indicating support or resistance zones). By aggregating trend information from multiple timeframes, it aids traders in making more informed decisions regarding market entry and exit points. The indicator is intended for use alongside other technical analysis tools to enhance trading strategies.
Indicator profile
Customer reviews
0.0
Reviews: 0
Customer reviews
No reviews for this product yet. Already tried it? Be the first to tell others!
Discussion
FAQ
Products available through cTrader Store, including trading bots, indicators and plugins, are provided by third-party developers and made available for informational and technical access purposes only. cTrader Store is not a broker and does not provide investment advice, personal recommendations or any guarantee of future performance.















Price
11.64M
Traded volume
165.2K
Pips won
56
Sales
5.05K
Free installs