

Candles_Painter
インジケーター
3 購入済
バージョン 1.0、Aug 2025
Windows、Mac
4.6
レビュー: 3
登録日 26/05/2025
494.31M
取引数量
65.57K
獲得pips
16
販売
1.69K
無料インストール
説明
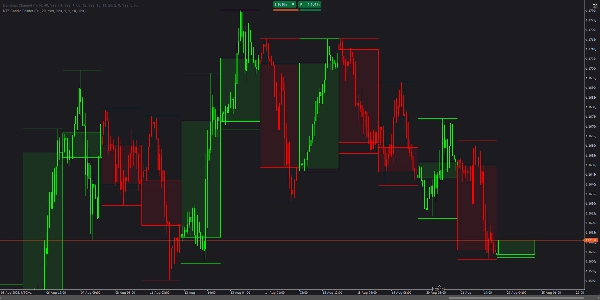
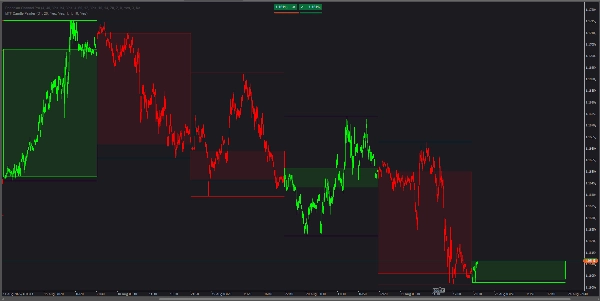
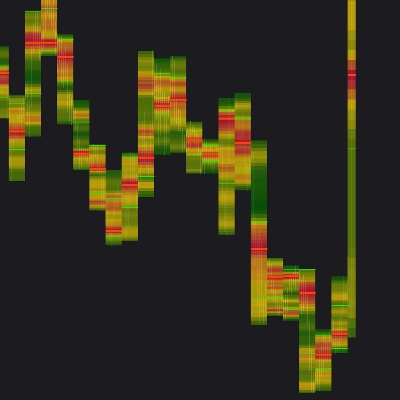
MTFキャンドルペインター は、現在のチャート上に 上位時間軸(HTF) のコンテキストを直接オーバーレイします。アクティブな時間軸のすべてのバーを囲むHTFキャンドルの方向で色付けし、塗りつぶされた HTFボディ矩形(始値–終値のみ、ヒゲなし)とオプションの HTF高値/安値 ラインを描画します。別々の強気/弱気の色と調整可能な塗りつぶしの不透明度により、一目でわかるクリーンで読みやすいバイアスを提供します。
主な特徴
- マルチタイムフレームバーの色付け: HTFキャンドル内のすべてのバーは、その強気/弱気の色を継承します。
- HTFボディオーバーレイ: HTFの始値と終値の間の矩形;明瞭さのために中央のヒゲはありません。
- 別々の強気/弱気スタイリング: 強気および弱気のHTFキャンドルに対する独立したアウトラインと塗りつぶしの色。
- 調整可能な不透明度: 価格との重ね合わせをきれいにするための塗りつぶしの透明度設定(デフォルト10%)。
- HTF高値/安値ライン: オプションで、太さを設定可能。
- ルックバック制御: 描画する最近のHTFキャンドルの数を選択(デフォルト20)。
- 軽量: ネイティブチャートオブジェクトを使用;高速で目立たない。
パラメーター
コア
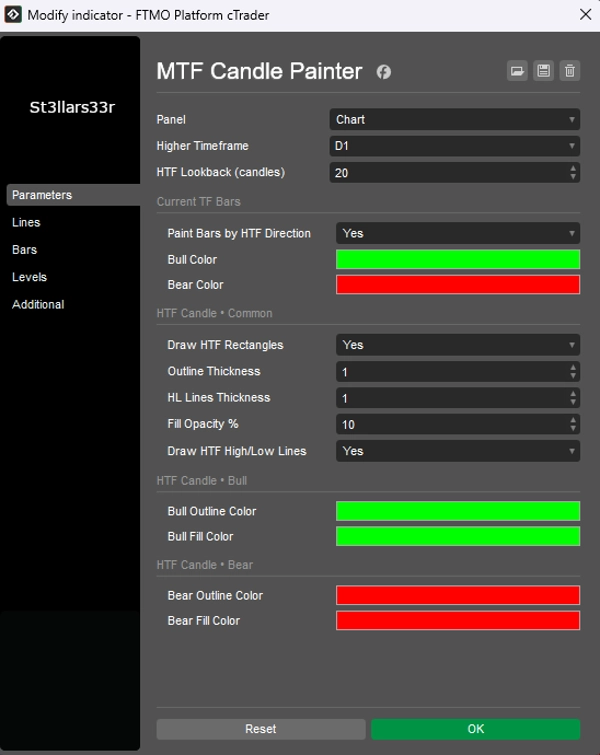
Higher Timeframe– オーバーレイするHTF(例:D1、H4、W1)。HTF Lookback (candles)– 描画するHTFキャンドルの数(デフォルト 20)。
現在のTFバー
Paint Bars by HTF Direction– 囲むHTFキャンドルによって現在のTFバーを色付け(はい/いいえ)。Bull Color/Bear Color– 現在のTFバーの色。
HTFキャンドル・共通
Draw HTF Rectangles– HTFボディ矩形を表示(デフォルト はい)。Outline Thickness– HTFボディのアウトラインの太さ。HL Lines Thickness– HTF高値/安値ラインの太さ。Fill Opacity %– HTFボディ塗りつぶしの透明度(デフォルト 10%)。Draw HTF High/Low Lines– HTF高値/安値ラインの切り替え(はい/いいえ)。
HTFキャンドル・強気
Bull Outline Color– 強気HTFキャンドルのアウトライン色。Bull Fill Color– 強気HTFキャンドルの塗りつぶし色。
HTFキャンドル・弱気
Bear Outline Color– 弱気HTFキャンドルのアウトライン色。Bear Fill Color– 弱気HTFキャンドルの塗りつぶし色。
対象ユーザー
- 日中取引トレーダーおよびスキャルパー チャートを切り替えずに連続したHTFバイアスが必要な方。
- SMC/Wyckoff実践者 低いTFでの実行中に上位時間軸の構造に依存する方。
- 作業時間軸に クリーンで視覚的なHTFコンテキスト を重ねたいすべての方。
概要
AI summary
Candles_Painter is a multi-timeframe indicator designed to overlay higher timeframe (HTF) candle context onto a lower timeframe chart. It visually colors each bar on the active timeframe according to the bullish or bearish direction of the enclosing HTF candle. The indicator draws filled rectangles representing the HTF candle bodies (open to close, excluding wicks) with customizable fill opacity and separate colors for bullish and bearish candles. Optional HTF high and low lines can also be displayed with adjustable thickness.
Key features include:
- Coloring of all bars within an HTF candle by its direction.
- HTF body overlays for clear visual bias.
- Independent styling for bullish and bearish HTF candles.
- Adjustable transparency for neat integration with price data.
- Configurable lookback period for the number of HTF candles shown.
- Lightweight implementation using native chart objects for performance.
Users can customize parameters such as the higher timeframe to overlay (e.g., daily, 4-hour), colors for bars and HTF candles, opacity, and whether to display HTF high/low lines. This tool is suited for intraday traders, scalpers, and market structure practitioners who require continuous HTF context without switching charts.
Key features include:
- Coloring of all bars within an HTF candle by its direction.
- HTF body overlays for clear visual bias.
- Independent styling for bullish and bearish HTF candles.
- Adjustable transparency for neat integration with price data.
- Configurable lookback period for the number of HTF candles shown.
- Lightweight implementation using native chart objects for performance.
Users can customize parameters such as the higher timeframe to overlay (e.g., daily, 4-hour), colors for bars and HTF candles, opacity, and whether to display HTF high/low lines. This tool is suited for intraday traders, scalpers, and market structure practitioners who require continuous HTF context without switching charts.
インジケーターのプロフィール
カスタマーレビュー
4.6
レビュー: 3
5 | 67 % | |
4 | 33 % | |
3 | 0 % | |
2 | 0 % | |
1 | 0 % |
カスタマーレビュー
September 4, 2025
What stood out was it helps the review while staying in the background. Demo first makes more sense.
September 1, 2025
The log becomes easier to read, but a manual check is still part of the process.
August 27, 2025
A few ugly trades are useful in the sample, and it makes the setup easier to question.
ディスカッション
よくあるご質問
cTrader Storeで入手可能な取引ボット、インジケーター、プラグインなどの商品は、第三者の開発者が提供するものであり、情報と技術の取得のみを目的としてご利用いただけます。cTrader Storeはブローカーではなく、投資助言や個人的な推奨を行うことも、将来のパフォーマンスを保証することもありません。















![「[Stellar Strategies] MARSI Signal Plotter」ロゴ](https://cdn.ctrader.com/image/webp/7b2b8da6-8f8e-4646-8d4a-4710c516c01e_25567)




価格
登録日 26/05/2025
494.31M
取引数量
65.57K
獲得pips
16
販売
1.69K
無料インストール