Descrizione
🚀 Trasforma il tuo trading Renko con una visualizzazione precisa delle ombre
Sblocca i dati di mercato nascosti che i grafici Renko standard non ti mostrano! 📈
✨ Cosa rende speciale questo indicatore?
🎯 Analisi reale a livello di tick - A differenza di altri indicatori che fanno supposizioni, questo strumento analizza ogni singolo tick all'interno di ogni mattone Renko per rivelare gli estremi di prezzo effettivi che si sono verificati durante la formazione.
🔍 Vedi ciò che gli altri non vedono - Scopri i veri massimi e minimi che si sono verificati all'interno di ogni mattone Renko, offrendoti preziose informazioni di mercato per decisioni di ingresso e uscita migliori.
💪 Caratteristiche chiave che lo distinguono:
🏗️ Tecnologia intelligente di archiviazione locale
- Salva automaticamente tutte le ombre calcolate nel tuo storage locale
- Non perdere mai i tuoi dati - anche quando cambi grafici, timeframe o riavvii cTrader
- Il caricamento incrementale intelligente evita il ricalcolo dei dati esistenti
- Impatto minimo sulle prestazioni al riavvio della piattaforma
⚡ Prestazioni fulminee
- Caricamento progressivo giorno per giorno con visualizzazione del progresso in tempo reale
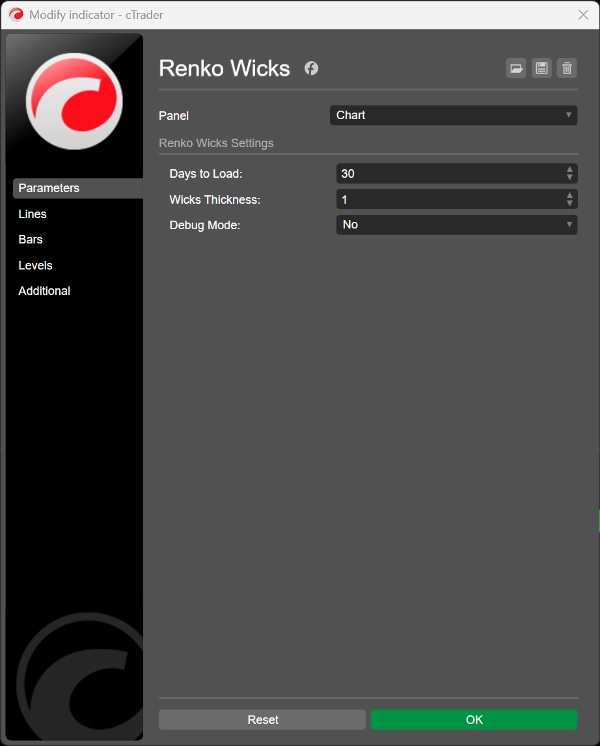
- Profondità della cronologia configurabile (1+ giorni)
- Uso ottimizzato della memoria per un funzionamento fluido del grafico
🎨 Design visivo professionale
- Si adatta automaticamente allo schema colori toro/orso del tuo grafico
- Spessore dell'ombra regolabile (1-5 pixel) per una visibilità perfetta
- Visualizzazione pulita e non invasiva che migliora la tua analisi
🛡️ Affidabilità solida come una roccia
- Persistenza dati al 100% - Le tue ombre resistono ai riavvii della piattaforma, ai cambi di grafico e ai cambi di timeframe
- La prevenzione intelligente dei duplicati garantisce grafici puliti
- Gestione degli errori integrata per la massima stabilità
- Modalità debug per trasparenza e risoluzione dei problemi
🎯 Perfetto per:
📊 Day Trader - Individua gli estremi intraday per opportunità di scalping precise
📈 Swing Trader - Identifica livelli chiave di supporto/resistenza all'interno dei mattoni Renko
🔄 Analisi multi-timeframe - Ogni timeframe mantiene il proprio database di ombre
🚨 Perché le ombre Renko sono importanti:
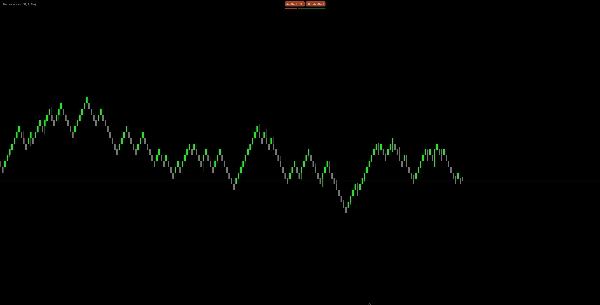
I grafici Renko standard mostrano solo l'apertura e la chiusura di ogni mattone, ma movimenti di prezzo enormi avvengono nel mezzo! Questo indicatore rivela:
- 📉 Vere livelli di supporto/resistenza dove il prezzo ha effettivamente toccato
- 🎪 Informazioni sulla volatilità di mercato all'interno di ogni formazione di mattone
- 🎯 Migliori punti di ingresso/uscita basati sugli estremi di prezzo reali
- 📊 Analisi migliorata della struttura di mercato per decisioni informate
Creato da un vero trader Renko ♥
Riepilogo
Key features include smart local storage that preserves calculated wick data across chart switches, timeframes, and platform restarts, ensuring data persistence and minimizing recalculations. The indicator offers fast, progressive day-by-day data loading with configurable history depth and optimized memory usage for smooth performance. Visually, it adapts to the chart’s bull/bear color scheme and allows adjustable wick thickness for clear, non-intrusive display.
Renko Wicks Pro supports multiple timeframes, maintaining separate wick databases for each, making it suitable for day traders seeking precise scalping points and swing traders identifying key levels. It includes built-in error handling, duplicate prevention, and a debug mode for stability and troubleshooting.
By revealing hidden price movements within Renko bricks, this indicator aids in identifying true market structure, improving entry and exit decisions based on actual price extremes.