

Description
🚀 Risk Appetite & Directional Bias ULTRA (cTrader) is a professional market-regime indicator designed to measure Risk-On / Neutral / Risk-Off conditions and convert them into a clear, actionable directional bias. Instead of relying on a single market, it compares two instruments (a “risk proxy” and a “benchmark”) to build a real-time Risk Score (0–100), highlight regime transitions, and summarize everything through an on-chart dashboard display.
🔧 What the first two parameters mean (and why they matter)
🟠 Risk Asset Symbol (BTC)
This is the risk proxy—the instrument used as a “risk appetite thermometer.” It is labeled “BTC” because the original concept uses Bitcoin as a global risk-on proxy, but you are not forced to use Bitcoin. You can set it to any asset that represents risk sentiment well (e.g., BTC, NASDAQ/US100, high beta indices, etc.).
🔵 Benchmark Symbol (SP/US500)
This is the reference market (benchmark) that you want to track for macro bias. It’s typically US500/SPX500, but it can be any instrument you consider your main “context driver.”
✅ In short:
- Risk Asset = sentiment sensor (risk appetite source)
- Benchmark = reference market you want the bias to reflect
❓ Do I have to use it on Bitcoin?
No. You can use the indicator in different ways depending on your goal:
✅ A) Macro “classic” Risk-On/Risk-Off (recommended)
- Risk Asset: BTCUSD
- Benchmark: US500 / SPX500
This gives a clean view of global risk regimes.
✅ B) Trading Bitcoin with macro context
- Risk Asset: BTCUSD
- Benchmark: US500 (or another macro reference)
This helps you understand when macro conditions support or oppose BTC.
✅ C) Multi-asset / custom market relationships
- Risk Asset: BTC or US100
- Benchmark: the market you want to filter (GER40, XAUUSD, etc.)
This turns the indicator into a flexible “sentiment engine.”
⚙️ How it works (core logic)
The model computes the following on both symbols:
📈 Returns (%) (optionally logarithmic for more stability)
📊 Volatility (standard deviation over the selected lookback)
🔗 Rolling correlation between the two return series
🎛️ Dynamic Weight that adjusts the risk proxy’s influence based on:
- correlation strength
- relative volatility
This produces an Adjusted Change signal which is:
- EMA smoothed
- normalized into a 0–100 Risk Score
📊 How to read it (the most important signals)
🎯 Risk Score (0–100) is your main compass:
🟢 Risk-On (score above the upper threshold, e.g., > 60)
→ risk appetite is strong, the environment often favors momentum/risk assets
🔵 Neutral (between lower and upper thresholds, e.g., 40–60)
→ transition / chop / mixed signals, filtering is recommended
🔴 Risk-Off (score below the lower threshold, e.g., < 40)
→ defensive environment, caution is higher, downside risk is often elevated
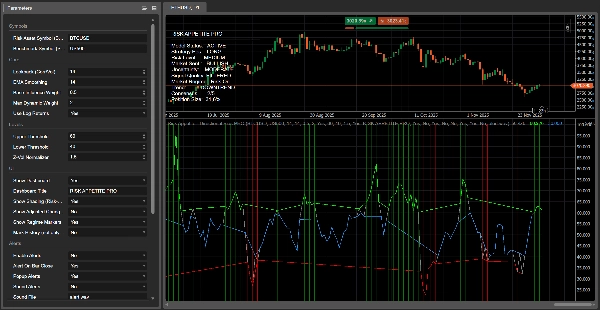
🔴 Why the red line “breaks” (and what it means)
In this ULTRA version the visualization is intentional and “regime-based”:
- A continuous base line (gray) is always visible
- Colored overlays appear only in their regime:
- Red overlay only during Risk-Off
- Green overlay only during Risk-On
- Blue overlay during Neutral
So when the market leaves Risk-Off and moves into Neutral (or Risk-On), the red overlay becomes empty (NaN) and cTrader stops drawing it—this is why it looks like it “interrupts.” ✅
📌 Important: this does not automatically mean the bearish trend is “over.”
It means the model no longer detects strong, confirmed Risk-Off conditions, so the bearish edge is reduced and the market is likely in transition.
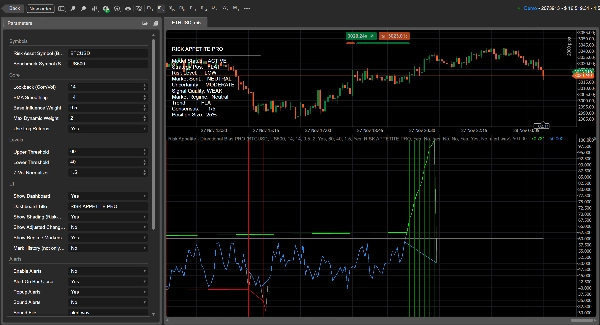
🖥️ What the on-chart display (dashboard) is for — explained line by line
The dashboard is your real-time decision panel. It summarizes regime, confidence, and tactical guidance so you don’t need to guess from the line alone.
✅ Model Status
Shows whether the model is running correctly.
- ACTIVE = valid data is available and calculations are correct
- NO DATA = missing symbol data, wrong symbol name, or not enough history/time alignment
🎯 Strategy Pos (Strategy Position)
A suggested stance based on regime:
- LONG = Risk-On
- SHORT = Risk-Off
- FLAT = Neutral
⚠️ Risk Level
A risk intensity measure based on market volatility and uncertainty.
- VERY LOW / LOW = more stable conditions
- MEDIUM = normal
- HIGH / VERY HIGH = higher noise, higher whipsaw risk; reduce size or demand stronger confirmation
🧠 Market Sentiment
A directional tone derived from the score level:
- BULLISH / BEARISH / NEUTRAL
🌫️ Uncertainty
Shows how “clear” the model is. It increases when:
- correlation weakens, or
- volatility rises (more unstable environment)
Levels: LOW / MODERATE / HIGH
🧪 Signal Quality
A combined rating based on:
- signal strength (distance from 50)
- uncertainty level
Outputs: STRONG / FILTERED / WEAK
🔥 Market Regime
The main classification:
- Risk-On / Neutral / Risk-Off
This is the core regime state driving color overlays, shading, and position bias.
📉 Trend
The short-term direction of the score (slope):
- UPTREND = rising risk appetite
- DOWNTREND = falling risk appetite
- FLAT = sideways / low momentum
🗳️ Consensus (X/5)
A simple alignment score that counts how many key conditions agree (direction, slope, correlation alignment, etc.).
Higher = cleaner, more consistent environment.
📏 Position Size
A suggested exposure percentage based on signal strength and uncertainty:
- strong & low uncertainty → higher size suggestion
- weak or uncertain → smaller size suggestion
🧭 Multi-timeframe advantage (very powerful in practice)
When you analyze the same market across multiple timeframes, the indicator updates and realigns per timeframe. This makes it easy to spot:
✅ Timeframe alignment (stronger signals)
✅ Timeframe conflict (often more neutral/choppy conditions)
Higher timeframes define the macro regime, lower timeframes help with timing entries inside that regime.
📌 Markers, alerts & notifications (ULTRA features)
✨ Regime markers print on the chart when the regime changes:
- Risk-On ↔ Neutral ↔ Risk-Off
This makes transitions instantly visible.
🔔 Alerts & notifications can be enabled so you receive:
- popup alerts (and optional sound)
- alerts on bar close (recommended to avoid false triggers while the candle is forming)
💬 Join our (optimizations + presets + tools)
Want the best performance out of this indicator? Join our Discord for:
✅ parameter optimization for your broker symbols
✅ ready-to-use presets (Crypto / Indices / FX)
✅ multi-timeframe setup guidance
✅ advanced tools and updates that improve signal filtering and execution quality
Summary
Customer reviews
5 | 100 % | |
4 | 0 % | |
3 | 0 % | |
2 | 0 % | |
1 | 0 % |


