Matrix Trend Heatmap PRO
Indicator
Version 1.0, Jan 2026
Windows, Mac
"Matrix Trend Heatmap PRO" uploaded image"Matrix Trend Heatmap PRO" uploaded image"Matrix Trend Heatmap PRO" uploaded image
28
Sales
252
Free installs

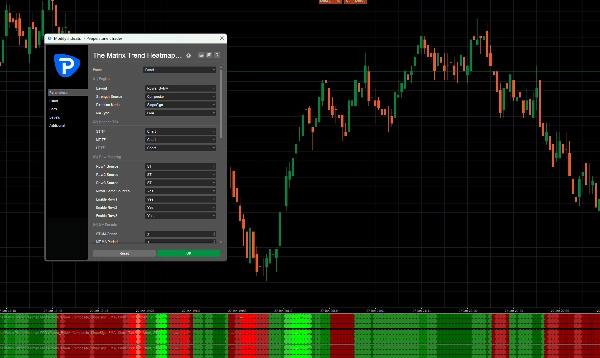
The Matrix Trend Heatmap pro

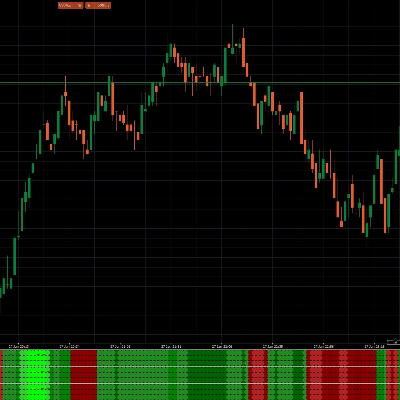
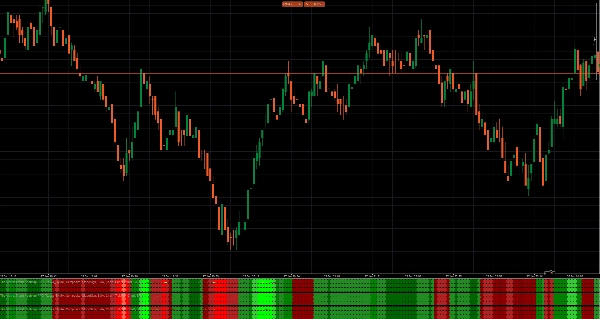
This indicator is a multi-horizon Trend & Strength Engine designed to show—at a glance—whether the market is bullish (green), bearish (red), or neutral, and how strong that directional bias really is.
Instead of relying on a single “trend line,” it blends EMA structure + slope direction + volatility (ATR) + consistency into one clean Composite Strength score. The result is a smoother, more reliable read on direction—especially on fast charts—without the constant flip-flopping you get in chop.

Default tuning (Tick 30 / 1-Minute)

The default settings are specifically tuned for Tick 30 and 1-minute charts. These values are not random—they are calibrated as a complete set to balance speed + stability, so the indicator reacts quickly to real trend shifts while filtering micro-noise.
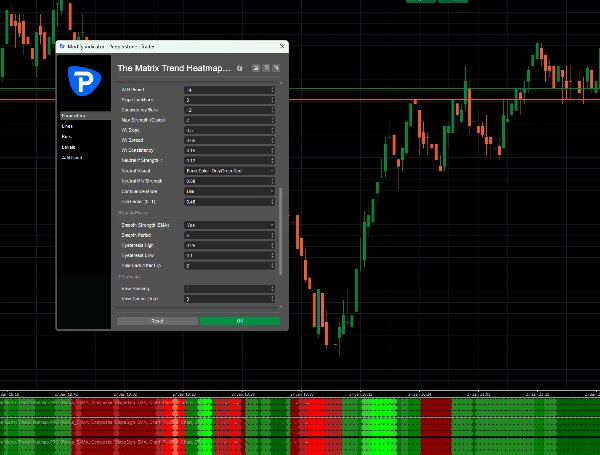
Default highlights:

  • MA Type: EMA
  • Direction Mode: SlopeSign
  • ST / MT / LT Timeframes: Chart (aligned logic, no TF mismatch)
  • ST / MT / LT MA Periods: 3 (fast response, ideal for Tick30/1m)
  • ATR Period: 14 (stable volatility normalization)
  • Slope Lookback: 3 (responsive without excessive flicker)
  • Consistency Bars: 12 (filters micro-chop on fast charts)
  • Max Strength: 2 (keeps visuals clean and controlled)

Composite weighting (defaults):

  • W: Slope = 0.50 (direction + momentum is the main driver)
  • W: Spread = 0.35 (movement “room/pressure” confirmation)
  • W: Consistency = 0.15 (trend quality over multiple bars)

Neutral threshold (default):

  • Neutral if strength < 0.12
    When strength drops below this level, the indicator intentionally treats the market as “no edge,” helping you avoid overtrading during range conditions.


What the indicator does

1) Direction (SlopeSign)

Direction is determined by the slope (angle) of the selected moving average (default: EMA).

  • Positive slope → Uptrend (green)
  • Negative slope → Downtrend (red)

2) Composite Strength (not just “trend on/off”)

The color and intensity represent trend strength, not only direction. Strong trends appear more decisive and stable; weak trends fade toward neutral.

3) Multi-horizon framework (ST / MT / LT)

The indicator supports multiple “horizons” (Short / Mid / Long). In the tuned defaults these are mapped to Chart timeframe to keep the behavior consistent and predictable on Tick 30 / 1-minute.


Why it’s useful (real trading value)

Most trend indicators fail in one of two ways:

  • they are too slow (late confirmation), or
  • they are too noisy (constant flips in sideways markets).

This engine solves that by combining:

  1. Slope (direction + momentum)
  2. Spread (movement pressure/room)
  3. Consistency (how cleanly the trend persists)

All normalized using ATR, so the behavior stays more stable across different volatility regimes—especially important on faster charts.


How to use it (simple and effective)

Trend filter (primary use)

  • Look for long setups only when the engine stays green.
  • Look for short setups only when the engine stays red.
  • In neutral, either wait—or only trade with extra confirmation and tighter targets.

Timing entries

Use your own trigger (pullback, breakout, pattern, etc.), but let the indicator define the directional context and strength.

Avoiding chop

Frequent neutral/weak phases = range/no edge.
That’s the indicator telling you: protect capital, reduce size, or wait for structure.


Safe tweaks (without breaking the tuning)

If you want it calmer (less sensitive):

  • Increase Slope Lookback from 3 → 4/5
  • Increase Consistency Bars from 12 → 14/16

If you want it faster:

  • Keep Slope Lookback at 3, and only slightly adjust Neutral threshold (e.g., 0.120.10) with care.

Tip: Change one parameter at a time. The defaults are tuned as a balanced system.


One-line summary

A fast, ATR-normalized EMA slope trend engine with a Composite Strength score (Slope + Spread + Consistency), default tuned for Tick 30 and 1-minute charts, designed to reduce noise and highlight high-edge trend conditions.

0.0
Reviews: 0
Customer reviews
No reviews for this product yet. Already tried it? Be the first to tell others!
Grid
NAS100
NZDUSD
Breakout
XAUUSD
FVG
Commodities
Martingale
Forex
Signal
EURUSD
MACD
GBPUSD
BTCUSD
AI
SMC
Indices
Prop
Stocks
Supertrend
Crypto
USDJPY
Scalping

More from this author

Indicator
Grid
NAS100
RSI
+19
Know sure thing
Know Sure Thing (KST) momentum engine
Indicator
Grid
RSI
Breakout
+19
Buy and sell indicator
Buy and Sell Signals
Indicator
NAS100
NZDUSD
Martingale
+26
RollingZSoreTrend V1
Rolling Z-Score Trend, A clean, statistical trend & momentum indicator
Indicator
Grid
Breakout
Martingale
+4
Coloring Trendline with arrows
Coloring trendline/ Colored Trendline / Color Trendline
Indicator
NAS100
NZDUSD
Martingale
+22
ALGO-XL KST HeatPulse Pro
A modern Know Sure Thing (KST) momentum oscillator with ALGO-XL style heat visualization, clean signals.
Indicator
NAS100
NZDUSD
Martingale
+26
overbought oversold
Overbought Oversold Indicator
Indicator
NAS100
NZDUSD
Martingale
+26
MACD ColorFlow Moving Average v1
MACD ColorFlow Moving Average, A clean, visual trend line driven by MACD momentum.
Indicator
NAS100
NZDUSD
Martingale
+25
Aggressive Entry Momentum MACD Power Guide
Entry Momentum MACD Power Guide
Indicator
Grid
XAUUSD
Breakout
+12
heatmap kopie
Dynamic Liquidity Depth exposes hidden volume
Indicator
NAS100
NZDUSD
Martingale
+26
The Professional “All-in-One” Trading Suite
The Professional “All-in-One” Trading Suite (buy and sell indicator)
Indicator
Grid
Indices
Breakout
+9
crossover 1
Crossover Buy and Sell Alerts and signals
Indicator
NAS100
NZDUSD
Martingale
+26
Support and Resistance
Support and Resistance with signals

You may also like

Indicator
Breakout
Signal
Kecia Footprint Orderflow
Real-time orderflow footprint Indicator. Get your edge now!
Indicator
Indices
RSI
Prop
+4
CG Swing Signal
One of the best indicators we have ever developed, with a very high profit ratio.
Indicator
Indices
Signal
Whale Hunting For boom crash
The **Whale Hunting Indicator** is a trading tool for **Boom & Crash and Volatility indices**, featuring **Auto Trend De
Indicator
NAS100
NZDUSD
XAUUSD
+12
WT - PJER
Statistical boundaries that adapt to real-time volatility for a better risk management.
Indicator
NAS100
NZDUSD
XAUUSD
+12
Phoenix SMC V5.2
Non-Repainting Logic All Signals Are Generated In Real Time And Remain Locked Once Printed. No Hindsight Adjustments.
Indicator
NAS100
NZDUSD
Breakout
+12
Initial Balance Breakout Signals
📈 Initial Balance Breakout Signals: visually accurate IB levels, breakout alerts & forecast zones for smart trading.
Indicator
XAUUSD
Forex
EURUSD
+3
Fx4U.Risk & Reward Trading Tool.v2.16 -Indicator
This is a tool to help traders open orders/close orders/modify orders quickly with just one click
Indicator
Grid
NAS100
RSI
+17
Market Depth Visualizer_DOM_noSourceCode
Advanced Level 2 market analysis tool.
Indicator
NAS100
NZDUSD
XAUUSD
+12
Coral Filter X Pro
🐠 Coral Filter X Pro turns trend detection into a simple, repeatable workflow 🐠
Indicator
Breakout
Scalping
SMC
Bubble Indicator 2.0
Delta Peak Bubbles is a tick‑chart overlay for cTrader that highlights the strongest momentum spikes.
Indicator
RSI
Breakout
Supertrend
Leverage Liquidation Map
📊 Liquidation Map: Potential areas where highly leveraged investors might face liquidations.
Indicator
NAS100
NZDUSD
Martingale
+26
The Market Temperature Moving Average
The "Market Temperature" Moving Average -Turn Your MA Into a Live Market Temperature Line
28
Sales
252
Free installs