
WeTrades Trend Rider EMA
Indicator
47 downloads
Version 1.0, May 2026
Windows, Mac
Trading product for WeTrades Trend Rider EMA Indicator EMA Moving Average, image 2
Trading product for WeTrades Trend Rider EMA Indicator EMA Moving Average, image 3
Trading product for WeTrades Trend Rider EMA Indicator EMA Moving Average, image 4
Trading product for WeTrades Trend Rider EMA Indicator EMA Moving Average, image 5
Trading product for WeTrades Trend Rider EMA Indicator EMA Moving Average, image 6
Trading product for WeTrades Trend Rider EMA Indicator EMA Moving Average, image 7
2.67K
Free installs

Description

WeTrades Trend Rider EMA – Built to Avoid Fake Moves

As a gold trader, one of the biggest problems I faced was getting trapped in fake bullish candles during a bearish trend.

Price would suddenly print strong green candles, looking like a reversal, and I’d enter too early—only to watch the main trend continue against me.

That’s exactly why I built WeTrades Trend Rider EMA.

This indicator is designed to keep you focused on the real trend, not temporary market noise.

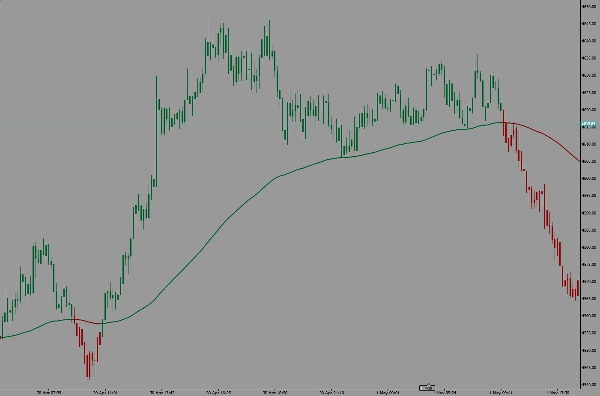
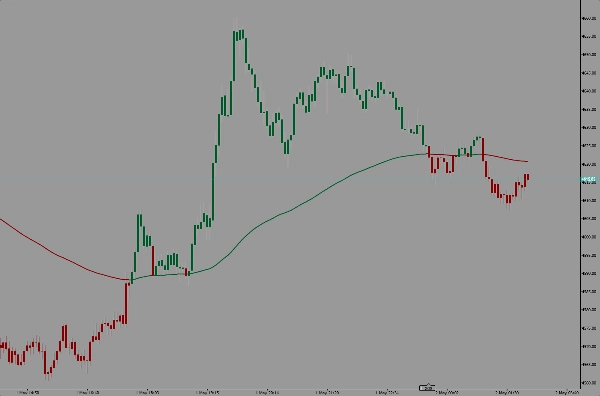
It uses an Exponential Moving Average (EMA) as the trend filter and colors candles based on where price closes relative to the EMA.

How it works

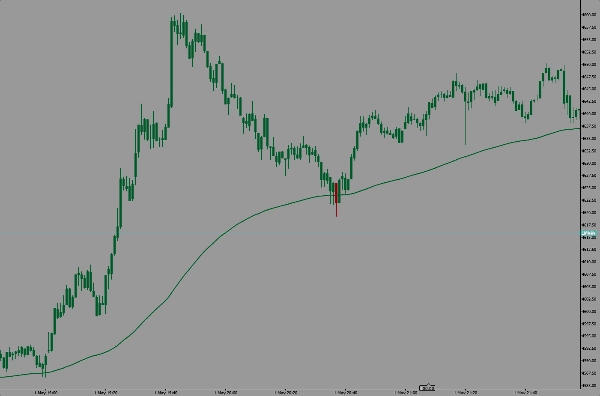
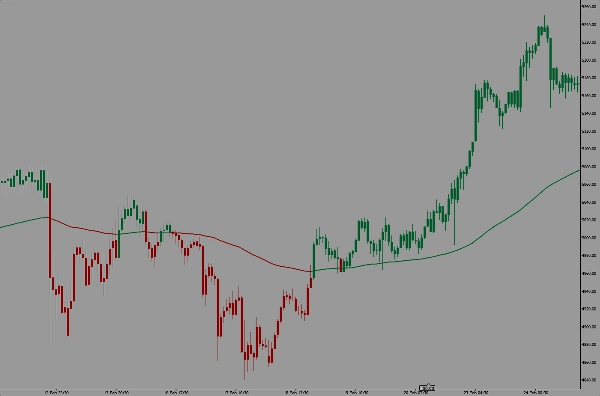
  • If price closes above the EMA → candles turn bullish
  • If price closes below the EMA → candles turn bearish
  • The EMA line changes with the same logic for clean trend confirmation

The goal is simple:

Don’t trade every candle. Trade the trend.

A bullish candle inside a bearish trend can often be just a pullback—not a reversal.

This indicator helps you identify that difference faster.

Why I use it

In gold, fake moves happen fast.
Strong candles can trap traders into thinking momentum has changed.

With Trend Rider EMA, I can quickly see:

✔ Is this a real trend shift?
✔ Is this just a pullback?
✔ Am I trading with momentum or against it?

Best for

  • Gold traders
  • Scalpers
  • Intraday traders
  • Trend-following traders

My trading rule

Green candles above EMA = bullish strength
Red candles below EMA = bearish strength

Simple visual confirmation.
Less hesitation.
Less fakeouts.
Better trend discipline.

Built from real trading experience.
Made for traders who want cleaner trend reading and fewer bad entries.

Summary

AI summary
WeTrades Trend Rider EMA is a trading indicator designed to enhance trend identification by filtering out false market moves. It uses an Exponential Moving Average (EMA) as a trend filter and colors price candles based on their closing position relative to the EMA. Candles closing above the EMA are colored bullish, while those closing below are bearish. The EMA line itself adjusts accordingly to confirm trend direction visually.
This indicator aims to help traders focus on genuine trend shifts rather than temporary pullbacks or fake reversals, reducing premature entries against the main trend. It is particularly suited for gold traders, scalpers, intraday traders, and those employing trend-following strategies.
Key features include:
- Visual color-coded candles indicating bullish or bearish momentum relative to the EMA.
- EMA line that dynamically confirms trend direction.
- Simplified trend discipline by distinguishing real trend strength from market noise.
By providing clear visual cues, WeTrades Trend Rider EMA assists traders in making more informed decisions about trading with momentum and avoiding false signals.

Indicator profile
Indicator category
Trend
Output type
Visualisation
Data requirements
Bars only
Supported signals
Breakout
Reversal
Trend strength
Level break
Level touch

Customer reviews

0.0
Reviews: 0
Customer reviews
No reviews for this product yet. Already tried it? Be the first to tell others!

Discussion

FAQ

EMA
Moving Average
Products available through cTrader Store, including trading bots, indicators and plugins, are provided by third-party developers and made available for informational and technical access purposes only. cTrader Store is not a broker and does not provide investment advice, personal recommendations or any guarantee of future performance.

More from this author

Indicator
ATR
Prop
+15
Smart trendline breakout indicator with auto signals, targets, and ATR-based zones for precise trade execution.
Indicator
AI
SMC
+18
Smart Money Concepts (SMC)
Indicator
SMC
Prop
+14
Fair Value Gap (FVG)
Indicator
ATR
MSS
+5
Volume-based support and resistance boxes with breakout, hold, and structure shift signals for precise trading decisions
Indicator
ATR
RSI
+15
Identifies high-probability breakout and retest zones using smart pivot structure and volatility filtering.
Indicator
AI
SMC
+18
ICT First Presented FVG
Indicator
MSS
Key Levels
+2
Marks liquidity zones at swing highs/lows, tracks touches, and confirms breaks to improve entries and structure clarity.
Indicator
SMC
Prop
+13
Smart Money traders, it extends key levels until mitigation, helping you track liquidity, structure
Indicator
MSS
Key Levels
+4
Auto-detects support/resistance, draws clean levels, and confirms breakouts with volume and wick rejection signals.
Indicator
SMC
Grid
+18
Golden Candle Fib By Wejoy
Indicator
ATR
BOS
+5
Smart SMC + Fibonacci engine with ATR filtering, dynamic levels, and precision entry signals.
cBot
Fixed Lot
Break Even
+2
Fast trade manager with hotkeys for break-even, partial closes, and instant exit control.

You may also like

Indicator
ATR
Market Structure
Adaptive multi timeframe market condition analyzer that identifies the most tradeable timeframe.
Indicator
Signal
🔹 Trend-Reversal-Indicator for cTrader 🔹 The ultimate Renko chart tool!
Indicator
EURUSD
GBPUSD
+3
All-in-one suite for ICT concepts: NY Midnight Open, Killzones, automatic Liquidity levels (PDH/L, PWH/L).
Indicator
Volume
Key Levels
+1
Order book indicator .Don't trade against the flow. Trade with the truth!
Indicator
Prop
Forex
+7
Heatmap of intra-HTF volume (POC/VA) built from LTF tick data; paints current candle and auto-loads visible history.
Indicator
ATR
EMA
+4
The FULL-MARKET-VIEW-DASHBOARD is a professional-grade trading suite for cTrader that eliminates market noise.
Indicator
Volume
Order Block
+4
Advanced Pro Volume Profile: Double Back-to-Back, Institutional Dynamic, Fixed Range & Order Flow
"ORB v1.1" logo
Popular
4.0
(3)
$25
Indicator
Breakout
Opening Range Breakout v1.1 - Visuals + Stats
Indicator
EMA
RSI
+2
Compact premium cTrader dashboard for market bias, sessions, premium/discount context, liquidity direction, ADR range an
Indicator
AI-assisted
Order Block
+5
The daily bias estimator indicator uses ICT concepts to show whether the chart is bullish or bearish on multi-time frame
Indicator
AI
ATR
+27
Deep Mood Distribution (DMD) is a segmented volume-profile and sentiment tool that analyzes price action in fixed bar bl
Indicator
SMC
Breakout
+1
Delta Peak Bubbles is a tick‑chart overlay for cTrader that highlights the strongest momentum spikes.
Indicator
RSI
Signal
+2
Identifies trends with moving averages & volatility. Base levels = bullish 🐂 or bearish 🐻 signals. Reversals detected!
Indicator
ATR
RSI
+16
Highlight market consolidation zones instantly with this Inside Candle indicator — precise, clean, and powerful.
Indicator
ZLSMA: Zero-lag trend indicator! Catch trends fast with customizable settings. Boost your trading precision.
Indicator
Forex
Crypto
+5
Automatically calculates the previous day’s high and low, determines the range, and then projects Fibonacci levels.
Indicator
ATR
Fibonacci
+4
Emperor Signals Pro is a premium non-repainting indicator for Forex pairs on the 15-minute timeframe
Indicator
SMC
Prop
+14
Right-anchored cTrader Volume Profile with VAH/VAL/POC, LVZ, top volume+EMA, themes, and fast, readable visuals.

Price

2.67K
Free installs