present
Sign up and get $50 off your first purchase
Trading product for SMC_CHOCH_BOS Indicator Key Levels MSS, image 1
SMC_CHOCH_BOS
Indicator
Version 1.0, May 2026
Windows, Mac
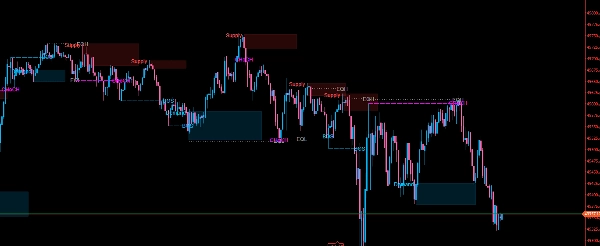
Trading product for SMC_CHOCH_BOS Indicator Key Levels MSS, image 2
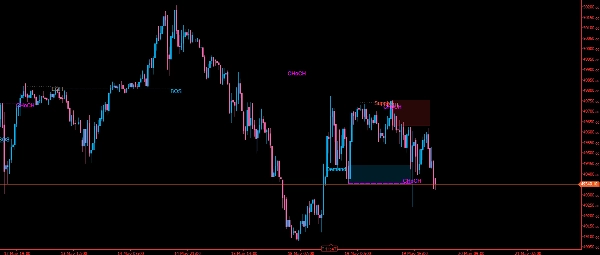
Trading product for SMC_CHOCH_BOS Indicator Key Levels MSS, image 3
Since 21/02/2025
466.3M
Traded volume
180.83K
Pips won
24
Sales
7.17K
Free installs

Description

SMC Ultimate Signals is a Smart Money Concepts indicator for cTrader that automatically identifies key market structure elements directly on your chart.

It detects Break of Structure (BOS) and Change of Character (CHoCH) by tracking confirmed swing highs and lows β€” a swing is only valid when a configurable number of bars on both sides confirm the pivot. A bullish BOS or CHoCH occurs when price breaks above the last swing high; bearish when it breaks below the last swing low. The difference between BOS and CHoCH depends on the current trend state: a break in the trend direction is a BOS, a break against it signals a CHoCH (trend reversal).

The indicator also marks Equal Highs (EQH) and Equal Lows (EQL) when two consecutive swing points fall within a configurable pip tolerance, hinting at liquidity pools.

Supply and Demand Zones are automatically drawn around the swing high or low that triggered a structure break. You can choose to display only the most recent supply and/or demand zone to keep the chart clean, and optionally extend all zones to the right edge of the chart.

Key parameters:

  • Swing Length β€” confirmation bars on each side
  • EQ Tolerance β€” pip distance for EQH/EQL detection
  • Max Bars β€” limit processing to the last N bars for performance
  • Zone Opacity & Extension β€” fine-tune visual appearance
  • Toggle BOS, CHoCH, EQH/EQL, zones, and swing markers independently

Summary

AI summary
SMC_CHOCH_BOS is a Smart Money Concepts indicator designed for the cTrader platform that automatically identifies key market structure elements on price charts. It detects Break of Structure (BOS) and Change of Character (CHoCH) by tracking confirmed swing highs and lows, where swings are validated by a configurable number of bars on each side. A bullish BOS or CHoCH occurs when price breaks above the last swing high; bearish signals occur when price breaks below the last swing low. The indicator distinguishes BOS and CHoCH based on the current trend state, identifying trend continuation or reversal accordingly.

Additionally, it marks Equal Highs (EQH) and Equal Lows (EQL) when consecutive swing points fall within a configurable pip tolerance, indicating potential liquidity pools. The indicator also automatically draws supply and demand zones around swing points that triggered structure breaks, with options to display only the most recent zones and extend them visually across the chart.

Key configurable parameters include swing length for pivot confirmation, equal high/low tolerance, maximum bars processed for performance, zone opacity and extension, and independent toggles for BOS, CHoCH, EQH/EQL, zones, and swing markers. The indicator provides visual signals to assist traders in analyzing market structure shifts and key levels.

Indicator profile
Indicator category
Support & resistance
Output type
Visualisation
Data requirements
Bars only
Supported signals
Level touch
Level break

Customer reviews

0.0
Reviews: 0
Customer reviews
No reviews for this product yet. Already tried it? Be the first to tell others!

Discussion

FAQ

Key Levels
MSS
BOS
CHOCH
Market Structure
Supply & Demand
Products available through cTrader Store, including trading bots, indicators and plugins, are provided by third-party developers and made available for informational and technical access purposes only. cTrader Store is not a broker and does not provide investment advice, personal recommendations or any guarantee of future performance.

More from this author

Indicator
RSI
Forex
+4
High-probability trading signals in the fast-paced world of forex and CFD trading.
Indicator
Prop
Stocks
+4
High-Performance Renko Chart Indicator with Advanced filtering method - built for Renko and candlestick charts.
Indicator
ATR
MSS
+5
Detects ICT Turtle Soup setups Ҁ” liquidity sweeps with MSS confirmation, ATR filter & kill zone session filter.
Indicator
SMC
Prop
+15
Automatic Elliott Wave Detection with Professional Filters
Indicator
Fibonacci
Key Levels
DailyTargets: Dynamic ADR-based levels & targets. Includes Buy/Sell zones, previous Hi/Lo, and automated trend alerts.
Indicator
MACD
Key Levels
+2
Trend indicator with multi-timeframe filters, generating signals only on fully completed bricks & candles. No Repaint.
Indicator
Key Levels
Order Block
+3
Marks NY session range, detects wick sweeps beyond box edges.. One signal per day. Overlay, no repainting!
Indicator
EMA
RSI
+2
Advanced TDI indicator with Shark Fin signals, chart arrows, MTF RSI, divergence detection and smart alerts.
Indicator
Key Levels
Supertrend
+3
Marks London and New York session opening zones and alerts you instantly on breakouts.
cBot
EMA
SL Manager
+5
Fully automated dual-symbol hedging cBot for cTrader.
20.6%
ROI
8.66
Profit factor
Indicator
BOS
Fair Value Gap
+1
ICT Quarterly Theory indicator Ҁ” color-coded Q1Ҁ“Q4 session zones with smart entry signals and real-time alerts.
cBot
RSI
Aggressive
automates entries based on the RSX indicator Ҁ” a smoothed, low-lag variant of the classic RSI.
1.67
Profit factor

You may also like

Indicator
ATR
Volume
+5
Order blocks with measured hold-rate stats and confidence scoring β€” not just zones on a chart.
Indicator
Key Levels
AI-assisted
+1
Draggable candle-close countdown timer with sound alert. Works on any timeframe and symbol. Cloud & Desktop ready.
Indicator
RSI
Indicator Stochastic With RSI
Indicator
Prop
Forex
+4
HMA MTF 2.0 (Multi-Timeframe )
Indicator
Engulfing
Fibonacci
+4
Six higher-timeframe candle sets on one chart, with liquidity sweep detection and swept levels.
Indicator
Signal
Cumulative Volume Delta tracks the net difference in tick volume between buying and selling pressure over time
Indicator
BTCUSD
EURUSD
+5
MA-based trend activator with four MTF modes, timeframe pattern resolution, and trendline projection.
Indicator
XAUUSD
Professional Volume Profile Indicator - Shows volume distribution, POC, Value Areas & Buy/Sell pressure.
Indicator
AI
SMC
+17
Smart Support/Resistance lines auto calculated from D1/H4/H1/M15. Highly customizable visuals + built in Backtest Mode.
Indicator
RSI
Forex
+12
Indicator pattern signal moment
Indicator
ATR
Channel
Reversal Trap Probability Bands plots a dynamic volatility envelope around price & automatically detects "trap" reversal
Indicator
ATR
Prop
+6
🟒 Strength-ranked S/R zones with MTF levels and Pro labels. Nearest-zone band and HUD for faster, cleaner entries. πŸ”΄
Indicator
ATR
Forex
+5
πŸš€ Buy and sell signals πŸ“ˆπŸ“‰ only when three independent engines agree simultaneously.
Indicator
ATR
SMC
+15
Plot ATR-based SL and 1R/2R/3R TPs instantly for any trade, with clear R-multiple risk mapping.
Indicator
Prop
Forex
+4
Visualize the four major trading sessions with color-coded rectangles showing session high/low ranges.
Indicator
Highlights market sessions & overlaps with real-time range & volume stats – perfect for pro scalpers.
Indicator
Forex
EURUSD
+8
This indicator plots the 15m opening range of the NY session with the first N FVGs presented on the chart after the open
Indicator
AI
ATR
+5
"Advanced VSA & CVD indicator with 'A+ Setup' filtering based on Support & Resistance levels."

Price

Since 21/02/2025
466.3M
Traded volume
180.83K
Pips won
24
Sales
7.17K
Free installs