

Description
Dynamic Fibonacci S/R Zones – Trade with Institutional-Grade Levels
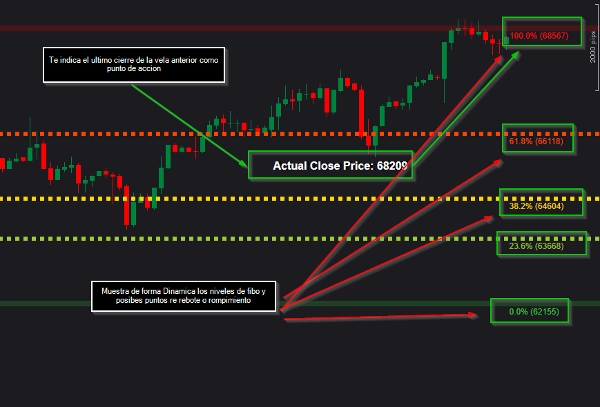
This indicator transforms traditional Fibonacci analysis by focusing exclusively on candle bodies, filtering out noise from wicks that often create false levels. The result: precise support and resistance zones where price truly reacts.
Key Advantages for Traders:
- Dynamic & Automatic – No manual drawing. The indicator continuously recalculates levels based on the most recent price structure.
- High-Probability Zones – Displays the most reliable Fibonacci levels (0%, 23.6%, 38.2%, 61.8%, 100%) where price tends to reverse or consolidate.
- Real-Time Price Reference – Shows the last closed price exactly at the center of the Fibonacci range, giving you instant situational awareness.
- Surgical Visual Design – Extreme levels (0% and 100%) are thicker and semi-transparent for better visual hierarchy. Text labels sit neatly above each line.
- Fully Customizable – Toggle any level on/off, adjust line thickness, text size, and lookback periods to fit any timeframe or strategy.
- No Repainting, No Lag – Calculations are based on confirmed closed candles. Reliable and honest signals.
Advantage Over Standard Fibonacci Tools:
Most tools use highs and lows including wicks, generating false zones. This indicator uses candle bodies only, reflecting true market decisions made by buyers and sellers.
Ideal for:
- Swing traders looking for reversal zones
- Scalpers needing quick S/R references
- Breakout traders watching key thresholds
- Any trader who values clean, actionable levels
Operational Edge:
Make faster, more confident trading decisions by knowing exactly where price is likely to pause, reverse, or accelerate.
Summary
AI summary
Analisis Fibo Mejorado is a dynamic Fibonacci support and resistance indicator designed for trading platforms. It calculates key Fibonacci levels (0%, 23.6%, 38.2%, 61.8%, 100%) based exclusively on candle bodies rather than wicks, aiming to reduce noise and highlight true market reaction zones. The indicator automatically updates these levels in real time using the most recent price structure, eliminating the need for manual drawing.
Key features include a clear visual hierarchy with thicker, semi-transparent lines for extreme levels, customizable display options (line thickness, text size, lookback periods), and reliable signals based on closed candles to avoid repainting or lag. It shows the last closed price centered within the Fibonacci range to provide immediate price context.
This tool is suitable for various trading styles such as swing trading, scalping, and breakout strategies, offering precise, actionable support and resistance zones. It supports level-touch signals and requires bar data input. The indicator aims to assist traders in identifying high-probability reversal or consolidation areas to make faster, more confident decisions.
Key features include a clear visual hierarchy with thicker, semi-transparent lines for extreme levels, customizable display options (line thickness, text size, lookback periods), and reliable signals based on closed candles to avoid repainting or lag. It shows the last closed price centered within the Fibonacci range to provide immediate price context.
This tool is suitable for various trading styles such as swing trading, scalping, and breakout strategies, offering precise, actionable support and resistance zones. It supports level-touch signals and requires bar data input. The indicator aims to assist traders in identifying high-probability reversal or consolidation areas to make faster, more confident decisions.
Indicator profile
Indicator category
Support & resistance
Output type
Signals
Data requirements
Bars only
Supported signals
Level touch
Customer reviews
0.0
Reviews: 0
Customer reviews
No reviews for this product yet. Already tried it? Be the first to tell others!
Discussion
FAQ
Fibonacci
ADX
Bollinger Bands
Breaker Block
Channel
ATR
Support & Resistance
Products available through cTrader Store, including trading bots, indicators and plugins, are provided by third-party developers and made available for informational and technical access purposes only. cTrader Store is not a broker and does not provide investment advice, personal recommendations or any guarantee of future performance.
More from this author














Price
Since 08/05/2026