Description
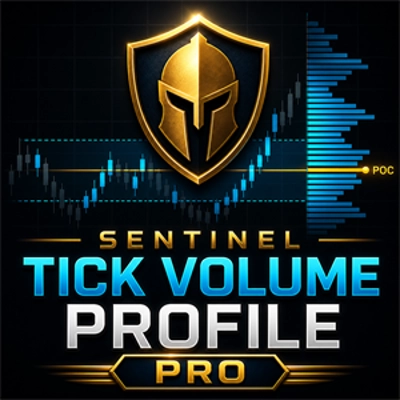
Sentinel Tick Volume Profile Free is a non-trading cTrader indicator that converts available chart tick-volume data into a visual price-distribution profile. It is designed to help manual traders understand where tick activity was concentrated within a selected chart range.
The indicator works in three main steps:
1. Select the Profile Range
The indicator first decides which bars should be included in the profile calculation.
There are two range modes:
Lookback Bars
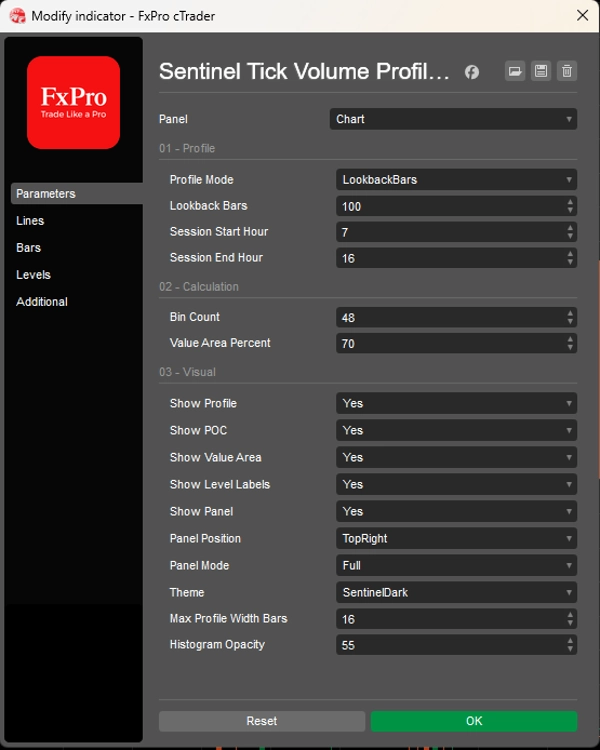
Uses a fixed number of recent chart bars. For example, if Lookback Bars is set to 240, the indicator builds the profile from the most recent 240 bars available on the chart.
Current Session
Uses the configured Session Start Hour and Session End Hour. The session hours are interpreted using indicator chart times. The indicator can handle active sessions, completed sessions, previous sessions, and overnight sessions.
This range selection determines the price area and tick-volume sample used for the profile.
2. Build the Tick-Volume Profile
After the range is selected, the indicator divides the selected high-to-low price range into a configurable number of price bins.
Each bar’s broker tick volume is then allocated into the bins touched by that bar’s high-low range.
This creates an estimated tick-volume distribution by price level.
From this distribution, the indicator calculates:
Estimated POC
The price bin with the highest broker tick-volume concentration.
Estimated VAH
The upper boundary of the estimated value area.
Estimated VAL
The lower boundary of the estimated value area.
Estimated Value Area
The area around the estimated POC that contains the selected percentage of total tick volume. The default value-area setting is 70%.
These values are estimates based on broker tick-volume data. They are not exchange-reported volume levels.
3. Display the Profile on the Chart
The indicator then displays the calculated profile as visual chart context.
It can show:
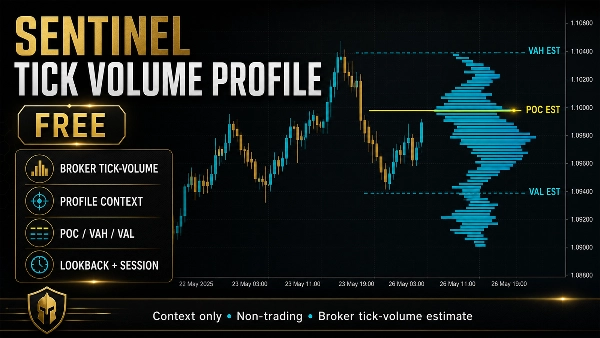
- A tick-volume profile histogram
- Estimated POC line
- Estimated VAH line
- Estimated VAL line
- Value-area shading
- Compact chart labels: POC est, VAH est, and VAL est
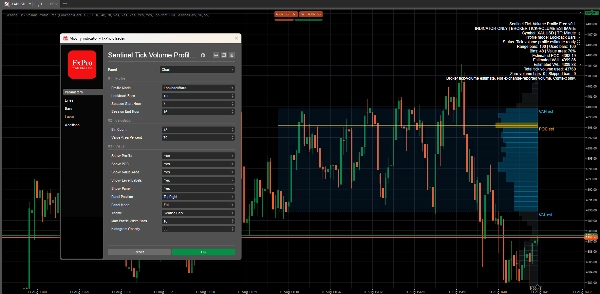
- A panel summary with the selected profile mode, range details, bin count, estimated levels, total tick volume used, and limitation wording
The chart labels can be turned on or off. The profile, POC, value area, and panel can also be controlled separately.
PANEL MODES
The indicator includes three panel modes:
Full
Shows the most complete information, including range bars, used bars, bin count, value-area percentage, estimated POC, estimated VAH, estimated VAL, total tick volume used, zero-volume bars, skipped bars, and the broker tick-volume limitation.
Compact
Shows a shorter summary with the mode, bin count, status, estimated POC, and value-area range.
Minimal
Shows a very compact one-line status focused on the estimated POC and context-only limitation.
Important Data Limitation
Sentinel Tick Volume Profile Free uses broker tick-volume data from the chart. It does not use exchange-reported volume, futures volume, footprint data, delta, tape data, or institutional order-flow data.
The profile is therefore best understood as a broker tick-volume profile estimate.
Values may vary depending on the broker, symbol, timeframe, session, and available chart history.
What the Indicator Does Not Do
Sentinel Tick Volume Profile Free does not place orders, modify positions, close trades, manage trades, or control cBots.
It does not provide buy signals, sell signals, entry confirmation, trade instructions, market predictions, win-rate estimates, performance forecasts, or profitability claims.
It is a manual visual context tool only.
Summary
The indicator divides the high-to-low price range of the selected bars into configurable price bins, allocating tick volume across these bins to estimate volume distribution by price level. It calculates key estimated levels including the Point of Control (POC)—the price bin with the highest tick volume concentration—along with the Value Area High (VAH), Value Area Low (VAL), and the Value Area itself, which by default covers 70% of total tick volume.
The profile is displayed visually on the chart with options to show a histogram, estimated POC, VAH, VAL lines, value-area shading, and compact labels. A panel provides summary information in three modes (Full, Compact, Minimal) detailing profile parameters and volume data. The indicator uses broker tick-volume data only and does not execute trades or provide trading signals. It serves as a manual visual tool to enhance market context understanding.