إذا قضيت أي وقت في أسواق الفوركس، فأنت تعلم مدى صعوبة معرفة العملة التي تدفع التحرك فعليًا، خاصة عندما تنظر إلى أزواج متعددة. كثيرًا ما وجدت نفسي أرغب في طريقة أوضح لرؤية أداء العملات الرئيسية بشكل فردي، وليس فقط كيف يتصرف زوج واحد.
لهذا السبب طورت هذا مؤشر قوة العملة النسبية.
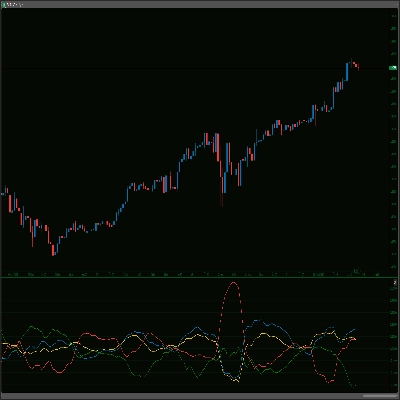
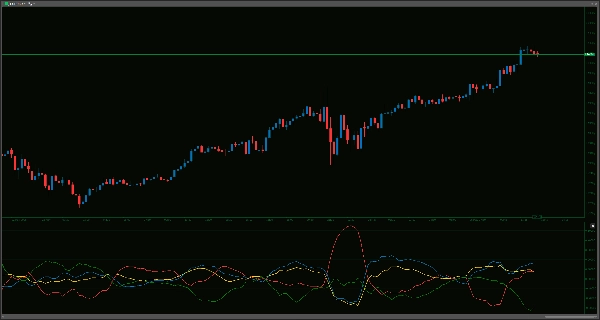
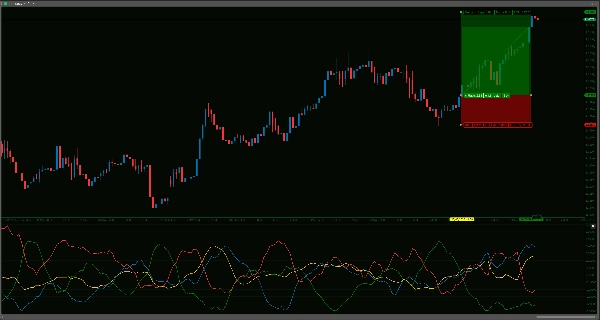
الفكرة بسيطة جدًا: يهدف إلى قياس وعرض القوة النسبية لـ AUD و USD و EUR و JPY. يفعل ذلك من خلال النظر في كيفية أداء كل من هذه العملات مقابل سلة من العملات الأخرى (تحديدًا عبر أزواج مثل AUDUSD و AUDEUR و AUDJPY و EURUSD و EURJPY و USDJPY) خلال فترة زمنية يمكنك تحديدها.
كيف وجدته مفيدًا، وكيف قد يساعدك:
- اختيار أزواج أفضل: أحيانًا، رؤية أن AUD يقوى باستمرار بينما JPY يضعف يمكن أن يدفعك لإلقاء نظرة أقرب على AUD/JPY. يمكن أن يساعد في تصفية الأزواج التي تركز عليها.
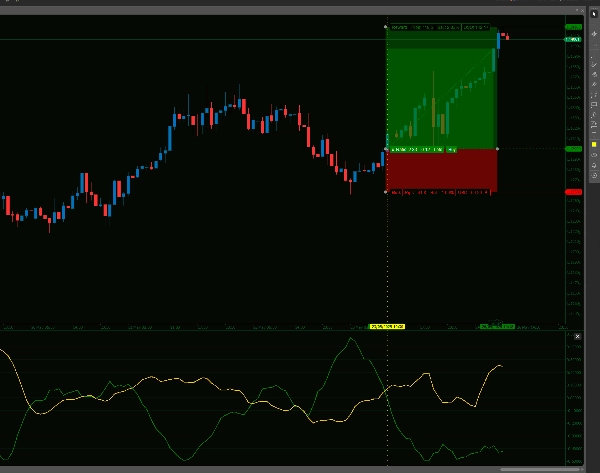
- فهم محركات السوق: عندما يتحرك زوج مثل EUR/USD، هل هو في الغالب قوة USD أم ضعف EUR؟ يمكن لهذا المؤشر أن يمنحك بعض الرؤية حول ذلك، مما يساعدك على فهم التدفق الأوسع.
- تخصيصه لأسلوبك:
-
- يمكنك تعديل
LookbackPeriod(الافتراضي هو 14 شريطًا). فترة أقصر ستكون أكثر استجابة، وفترة أطول ستظهر اتجاهات أكثر ترسخًا. - هناك أيضًا
SmoothingPeriod(الافتراضي هو 5 أشرطة) الذي يطبق EMA على خطوط القوة. يمكن أن يساعد هذا في تقليل بعض الضوضاء إذا كنت تفضل مخرجات أكثر سلاسة. إذا كنت تريد الحساب الخام، فقط اضبط التنعيم على 0.
- يمكنك تعديل
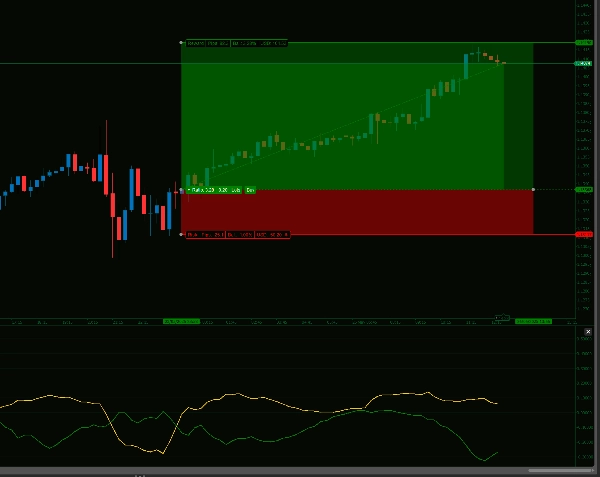
- مرئيات واضحة: يرسم قوة كل عملة كخط منفصل في نافذته الخاصة أسفل الرسم البياني الرئيسي، لذا لا يزدحم حركة السعر الخاصة بك.
- بيانات موثوقة: تتم الحسابات عند إغلاق كل شريط، لذا لن تعيد الخطوط الرسم أو تتغير بمجرد اكتمال الشريط.
لا يوجد مؤشر هو كرة بلورية، وهذا ليس استثناءً. إنه أداة. لقد وجدته جزءًا مفيدًا من عملية تحليلي، خاصة لتأكيد الأفكار أو الحصول على نظرة سريعة لما تفعله العملات الرئيسية.
تنبيه، نظرًا لأن هذا المؤشر يسحب بيانات لجميع أزواج العملات لحساب القوة النسبية الحقيقية بفعالية، فقد يكون هذا المؤشر مكثفًا على الموارد وقد يتسبب في تعطل Ctrader أحيانًا إذا كان لديك مؤشرات أخرى تستهلك موارد كثيرة أيضًا. حدث هذا مرة واحدة في الشهر الماضي على جهاز الكمبيوتر الخاص بي الذي يبلغ من العمر 5 سنوات، لذا لا ينبغي أن يحدث بانتظام. ولكن إذا حدث، فإن تحديث نافذة الإطار الزمني أو تعديل بسيط في إعدادات الفترة بزيادة أو نقصان 1 سيجبر على إعادة الحساب وسيظهر المؤشر مرة أخرى.
--------------------------
لا تتردد في الاطلاع على مؤشرات أخرى لي!
https://ctrader.com/products/1181
https://ctrader.com/products/1182
https://ctrader.com/products/1180
https://ctrader.com/products/1015
https://ctrader.com/products/555
https://ctrader.com/products/553
https://ctrader.com/products/554
https://ctrader.com/products/552
https://ctrader.com/products/557
https://ctrader.com/products/845
https://ctrader.com/products/848
https://ctrader.com/products/847
https://ctrader.com/products/846
https://ctrader.com/products/551
https://ctrader.com/products/574
https://ctrader.com/products/573
https://ctrader.com/products/556
https://ctrader.com/products/558
5 | 67 % | |
4 | 33 % | |
3 | 0 % | |
2 | 0 % | |
1 | 0 % |


