Trend Strength Signals St3llars33r
Indicatore
Versione 1.0, Aug 2025
Windows, Mac
Da 26/05/2025
451.48M
Volume negoziato
61.16K
Profitto in pip
15
Vendite
1.43K
Installazioni gratuite
Descrizione
Un toolkit visivo per il trend trading che combina un involucro di volatilità con un canale consapevole del ciclo per mostrare regime, tempistica e rischio a colpo d'occhio. È progettato per essere leggibile su qualsiasi sfondo (chiaro/scuro) e per mantenere lo schermo pulito pur fornendo suggerimenti su "cosa fare dopo".
Cosa vedi sul grafico
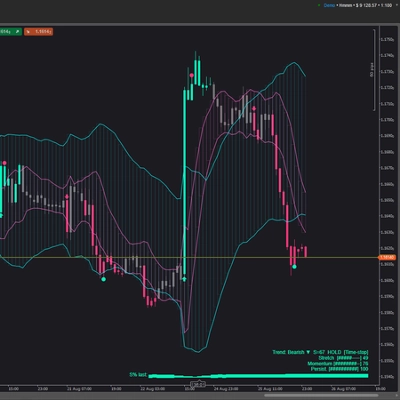
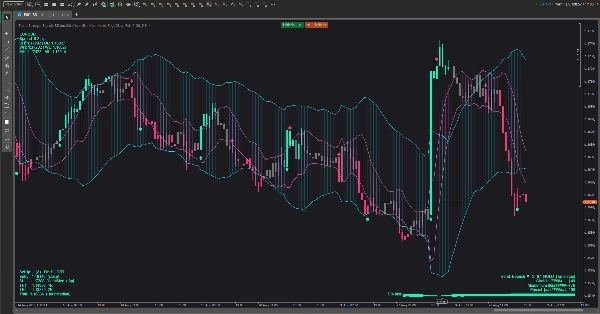
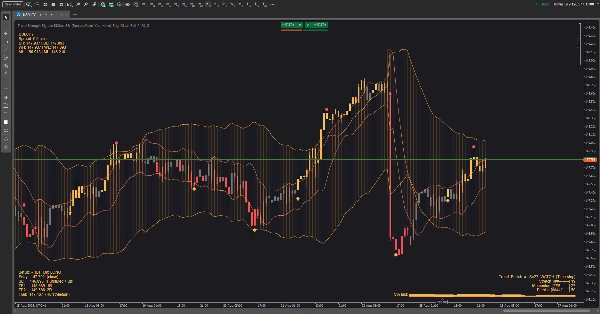
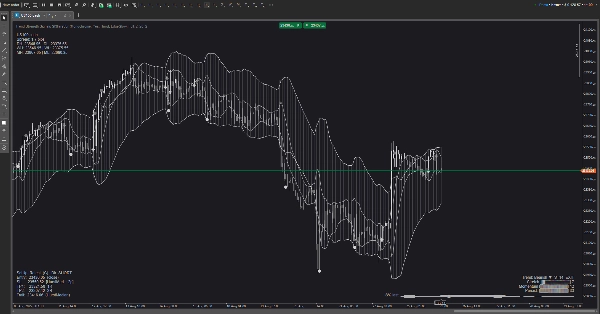
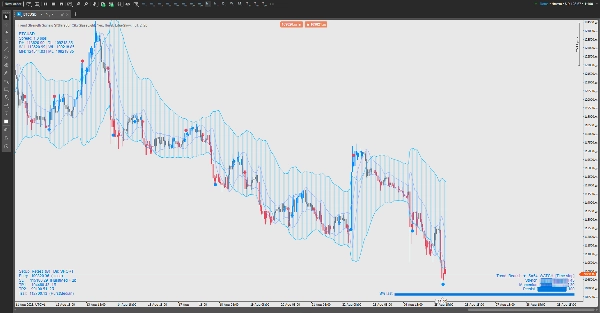
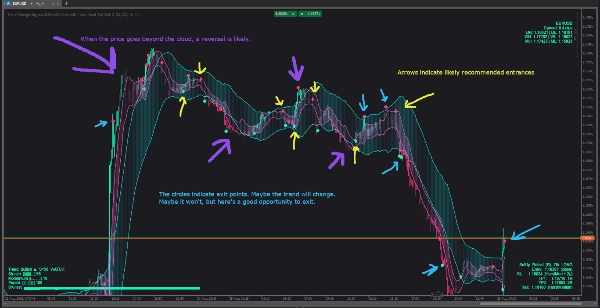
- Nuvole (attivabili):
-
- Una nuvola di volatilità che si espande/contrae con l'attività di mercato.
- Una nuvola di ciclo che segue il ritmo rotante del prezzo.
- Puoi mostrare una, entrambe o nessuna.
- Segnali: frecce discrete su/giù per potenziali inversioni di trend; piccoli punti per spintarelle di take-profit.
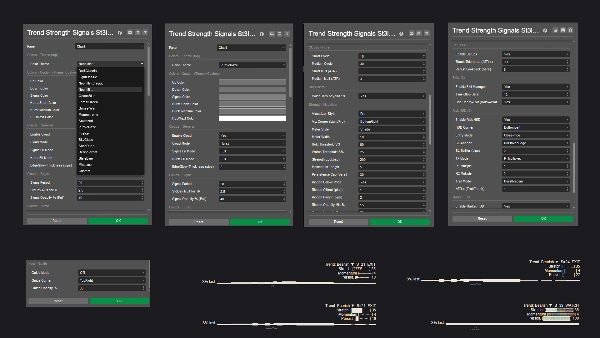
- Trend Strength HUD (tre stili):
-
- Light — un'etichetta di stato compatta.
- Pro — un piccolo cruscotto con tre misuratori (stretch, momentum, persistenza) più una mini sparkline storica.
- Ribbon — una barra morbida vicino al prezzo la cui intensità segue la forza del trend.
- Risk HUD: propone una direzione, un'area di stop protettiva, due obiettivi di profitto stratificati e un'idea di trailing opzionale. Si posiziona in qualsiasi angolo tu scelga e si aggiorna man mano che la barra evolve.
- Market HUD: simbolo & spread, più riferimenti di massimo-minimo giorno/settimana/mese, così sai sempre dove ti trovi nella mappa più ampia.
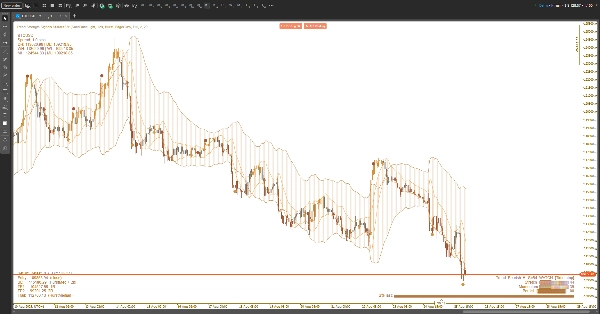
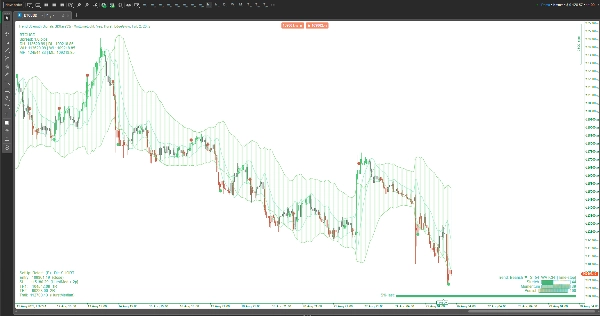
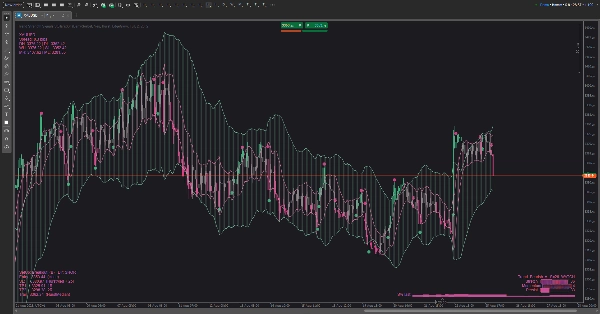
- Temi: set di colori curati per grafici chiari e scuri (e una modalità Personalizzata). Tutti gli elementi grafici—compresi HUD e segnali—seguono il tema attivo.
Come usarlo (pratico, non tecnico)
- Scegli la visualizzazione della nuvola:
-
- Usa la nuvola di volatilità per vedere compressioni ed espansioni.
- Usa la nuvola di ciclo per giudicare rotazioni “ai margini” vs “al centro”.
- Usa entrambe se vuoi contesto + tempistica.
- Leggi la Forza del Trend:
-
- Quando lo stato sale a HOLD, orienta le operazioni nella direzione attuale; quando scende a WATCH, riduci l'aggressività; se mostra EXIT, evita nuove operazioni o stringi il rischio.
- In modalità Pro, misuratori in aumento + sparkline in crescita = qualità in miglioramento; misuratori in calo = gestisci il rischio al ribasso.
- Temporizza gli ingressi con prezzo vs nuvola:
-
- I breakout dopo compressione, i rientri dopo un ritracciamento gentile verso la nuvola, o i rimbalzi da un bordo esterno sono i pattern principali.
- Se appare una freccia precoce a metà barra e poi scompare, aspetta la conferma alla chiusura della barra se preferisci meno falsi segnali.
- Gestisci l'operazione con il Risk HUD:
-
- Posiziona lo stop protettivo approssimativamente oltre il confine strutturale più vicino evidenziato dall'HUD.
- Scala in uscita a TP1, lascia che il resto punti a TP2 o segua la linea di trailing suggerita.
- Se la Forza del Trend decresce da forte a debole, considera di uscire prima.
- Filtri situazionali:
-
- Evita ingressi quando le nuvole sono sottili e frastagliate, o quando lo stato di forza è in EXIT.
- Favorisci operazioni quando la forza sta crescendo, la nuvola è inclinata e il prezzo interagisce pulitamente con i bordi.
Personalizzazione
- Cambia gli angoli dell'HUD, lo stile di visualizzazione e il tema colore per adattarli al tuo spazio di lavoro.
- I temi adatti alla luce mantengono il testo visibile su sfondi bianchi; le palette oceano/foresta/tramonto aggiungono un contrasto sottile senza abbagliare.
Cosa non
Questo non è un autotrader a scatola nera. È un aiuto decisionale: inquadra la qualità del trend, propone posizioni di rischio sensate e evidenzia momenti ad alta probabilità—ma resti tu a controllare.
Riepilogo
Profilo indicatore
Recensioni dei clienti
0.0
Recensioni: 0
Recensioni dei clienti
Questo prodotto non ha ancora ricevuto recensioni. L'hai già provato? Fallo sapere agli altri per primo!
Discussioni
Domande frequenti
I prodotti disponibili tramite cTrader Store, inclusi bot di trading, indicatori e plugin, sono forniti da sviluppatori terzi e resi disponibili esclusivamente a scopo informativo e di accesso tecnico. cTrader Store non è un broker e non fornisce consulenze in materia di investimento, raccomandazioni individualizzate o garanzie di risultati futuri.


Prezzo
Da 26/05/2025
451.48M
Volume negoziato
61.16K
Profitto in pip
15
Vendite
1.43K
Installazioni gratuite