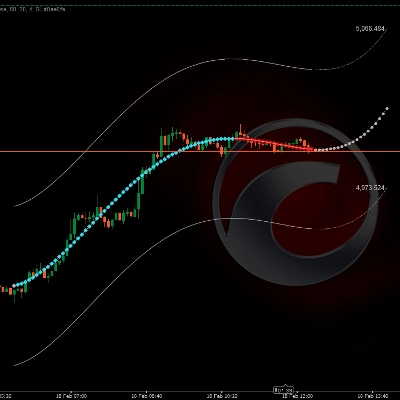
📊 Canal de Projeção de Preço Polinomial
https://chartshots.spotware.com/c/699603101593d
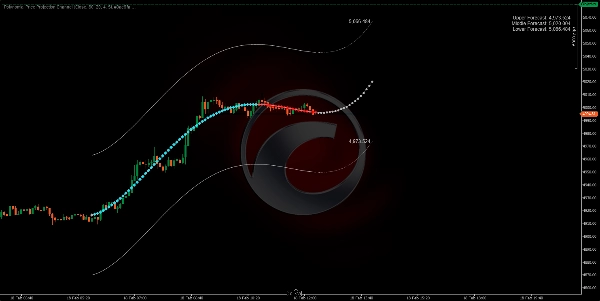
🔎 O QUE ELE FAZ?
https://chartshots.spotware.com/c/69960348da652
Ajusta uma curva matemática sobre os últimos N fechamentos de preço e estende-a para o futuro como uma projeção. Ao redor dessa curva, desenha um canal superior e inferior cuja largura se adapta automaticamente à volatilidade recente do mercado.
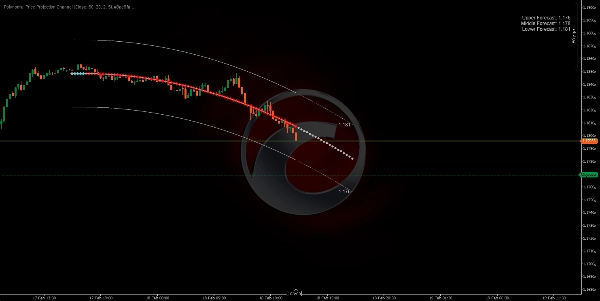
⚙️ COMO FUNCIONA A LÓGICA?
- Pega as últimas N velas (Barras de Retrospectiva) e calcula a curva polinomial que melhor se ajusta a esses preços usando mínimos quadrados.
- Estende a curva para frente (Barras de Previsão) como uma projeção matemática da tendência atual.
- Constrói o canal deslocando a curva para cima e para baixo usando o maior intervalo de vela do período analisado × 2.
https://chartshots.spotware.com/c/6996039a07e3a
🛠️ PARÂMETROS PRINCIPAIS
Parâmetro
Padrão
Propósito
Barras de Retrospectiva
80
Quantas velas históricas ele analisa
Barras de Previsão
20
Quantas velas ele projeta para frente
Ordem Polinomial
4
Flexibilidade da curva (maior = mais curvas)
Entrada de Dados
Fechamento
Preço base para o cálculo
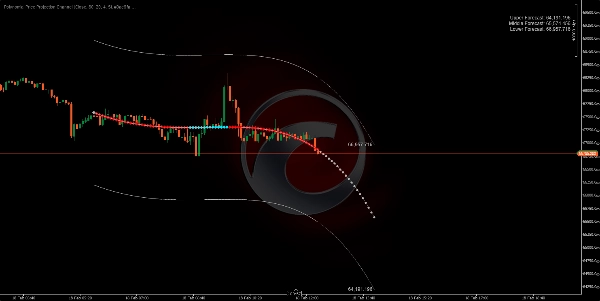
🎯 COMO USÁ-LO?
🟢 Compra Potencial → O preço toca a banda inferior e a projeção aponta para cima.
🔴 Venda Potencial → O preço toca a banda superior e a projeção aponta para baixo.
⚠️ Sempre confirme com outros fatores antes de negociar. Este indicador é uma extrapolação matemática, não uma previsão garantida.
5 | 0 % | |
4 | 100 % | |
3 | 0 % | |
2 | 0 % | |
1 | 0 % |


