

Session Trend
Indicador
Versão 1.0, Apr 2026
Windows, Mac
4.5
Avaliações: 2

2.92M
Volume negociado
140.43K
Pips ganhos
1
Vendas
Descrição
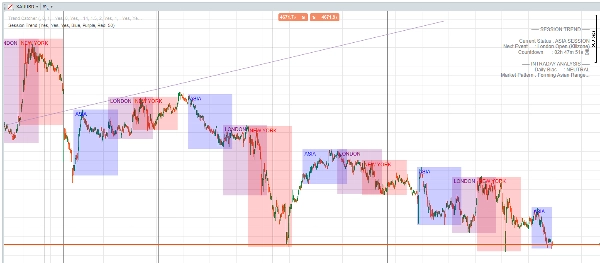
Domine a narrativa do ciclo diário com Session Pro. Este não é apenas um indicador de alta/baixa da sessão; é uma ferramenta analítica abrangente projetada para traders que precisam entender a relação entre a ação de preço da Ásia, Londres e Nova York.
Por que escolher Intraday Session?
- Tendência Intradiária Dinâmica: A lógica incorporada detecta automaticamente se o mercado está em uma fase de Expansão, Varredura ou Consolidação com base nas sobreposições das sessões.
- Rastreamento ICT Killzone: Identifica claramente janelas de volatilidade de alta probabilidade (Abertura de Londres e NY).
- Painel HUD ao Vivo: Uma exibição em tempo real, sem atraso, mostrando a fase atual do mercado, o próximo evento importante e um cronômetro regressivo ao vivo.
- Reconhecimento de Padrões: Veja instantaneamente se Londres quebrou a faixa asiática ou se Nova York está confirmando a tendência diária.
Por favor, comente se precisar fazer alguma solicitação sobre esta atualização do indicador!
Resumo
AI summary
Session Trend is an intraday trading indicator designed to analyze and interpret price action across major global sessions: Asia, London, and New York. It automatically detects the current market phase—Expansion, Sweep, or Consolidation—based on session crossovers, providing a dynamic intraday bias. The indicator highlights key volatility periods known as ICT Killzones, specifically the London and New York market opens, to assist in timing trades. It features a live HUD dashboard that displays the current market phase, upcoming major events, and a countdown timer in real time without lag. Additionally, it offers pattern recognition capabilities to identify whether the London session has broken the Asian range or if the New York session is confirming the daily trend. This tool integrates concepts from market structure and liquidity analysis, supporting traders in understanding session relationships and intraday market dynamics.
Perfil do indicador
Avaliações de clientes
4.5
Avaliações: 2
5 | 50 % | |
4 | 50 % | |
3 | 0 % | |
2 | 0 % | |
1 | 0 % |
Conversa
Perguntas frequentes
Supertrend
Market Structure
Liquidity Grab
Os produtos disponíveis através da cTrader Store, incluindo bots de negociação, indicadores e plugins, são fornecidos por programadores terceiros e são disponibilizados apenas para fins informativos e de acesso técnico. A cTrader Store não é um corretor e não fornece aconselhamento em matéria de investimento, recomendações pessoais ou qualquer garantia de desempenho no futuro.
Mais deste autor




















Preço
2.92M
Volume negociado
140.43K
Pips ganhos
1
Vendas