present
سجل واحصل على خصم 50 دولارًا على مشترياتك الأولى
Trading product for Royal ATR Trend Signals مؤشر EMA Supertrend, image 1
Royal ATR Trend Signals
مؤشر
الإصدار 1.0، May 2026
Windows, Mac
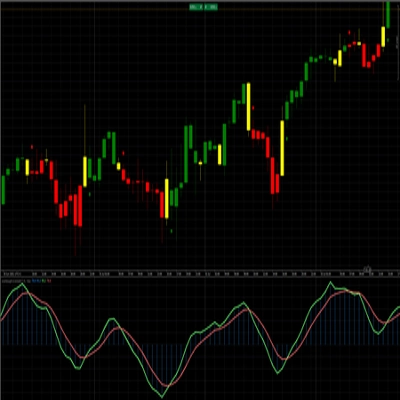
Trading product for Royal ATR Trend Signals مؤشر EMA Supertrend, image 2
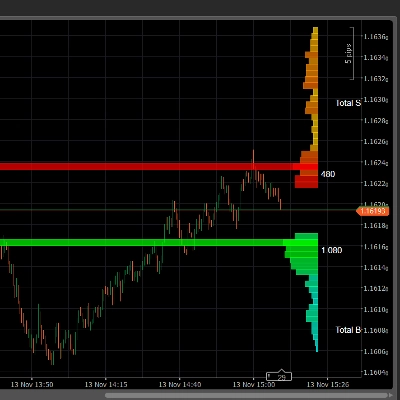
Trading product for Royal ATR Trend Signals مؤشر EMA Supertrend, image 3
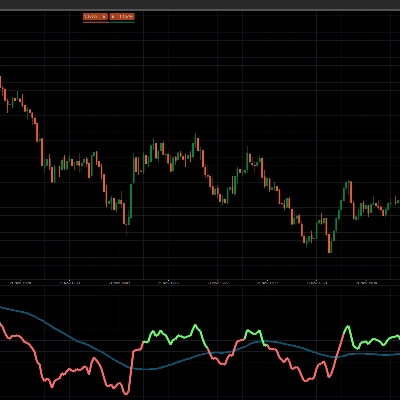
Trading product for Royal ATR Trend Signals مؤشر EMA Supertrend, image 4
86
المبيعات
1.18K
التثبيتات المجانية

الوصف

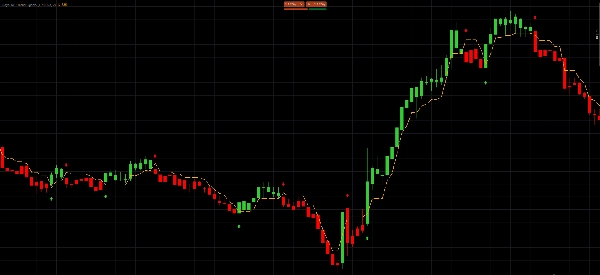
Royal ATR Trend Signals is a powerful trend-following indicator designed to identify high-probability buy and sell opportunities using volatility-based market movement. The indicator combines an ATR trailing stop engine, trend direction detection, optional Heikin Ashi smoothing, candle coloring, and clear arrow signals directly on the chart.

Instead of reacting to every small price fluctuation, Royal ATR Trend Signals uses market volatility to build a dynamic trailing stop. This helps traders filter noise, follow stronger directional moves, and spot potential trend reversals with greater clarity.

The indicator is built for traders who want a clean, fast, and visual system for identifying bullish and bearish momentum shifts.


Key Features

Volatility-Based Trend Detection
Uses Average True Range to adapt to current market conditions. When volatility increases, the trailing stop adjusts automatically.

Clear Buy and Sell Arrows
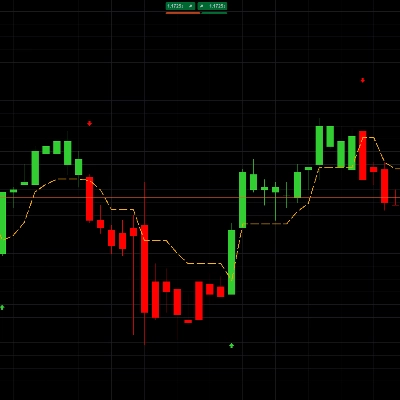
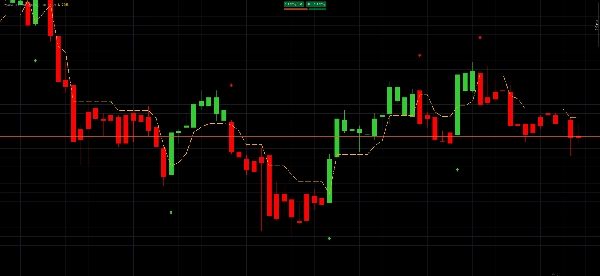
Green arrows highlight bullish trend signals, while red arrows highlight bearish trend signals.

ATR Trailing Stop Line
A dynamic stop line follows price action and acts as the main trend filter.

Candle Coloring
Candles are colored green when price is above the trailing stop and red when price is below it, giving instant visual trend confirmation.

Sensitivity Control
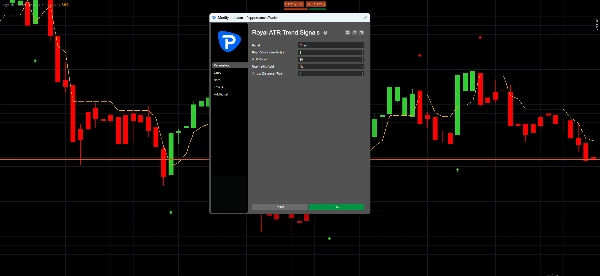
The Key Value setting allows traders to make the indicator more aggressive or more conservative.

Optional Heikin Ashi Mode
Heikin Ashi smoothing can be enabled to reduce noise and create cleaner trend signals.

Sound Alerts
The indicator can trigger sound alerts when a new buy or sell signal appears on the latest candle.


How It Works

Royal ATR Trend Signals calculates the market’s current volatility using the Average True Range. This ATR value is multiplied by the sensitivity setting to create a dynamic distance between price and the trailing stop.

When price stays above the ATR trailing stop, the market is treated as bullish. Candles are colored green, and the indicator looks for buy confirmation.

When price moves below the ATR trailing stop, the market is treated as bearish. Candles are colored red, and the indicator looks for sell confirmation.

A buy signal appears when price crosses above the ATR trailing stop and bullish momentum is confirmed.

A sell signal appears when price crosses below the ATR trailing stop and bearish momentum is confirmed.

The optional Heikin Ashi mode changes the source price calculation to a smoother candle value. This can help reduce false signals during choppy or noisy market conditions.


Trading Use

Royal ATR Trend Signals can be used for:

  • trend-following entries
  • momentum confirmation
  • trend reversal detection
  • trailing stop guidance
  • visual market direction filtering
  • scalping, intraday trading, and swing trading

For stronger setups, traders can combine the signals with support and resistance, liquidity zones, higher timeframe direction, or their own risk management strategy.

الملخص

ملف تعريف المؤشر
فئة المؤشر
الزخم
نوع المخرجات
الإشارات
متطلبات البيانات
بيانات التيك
الإشارات المدعومة
التقلب

مناقشة

تقييمات العملاء

0.0
التقييمات: 0
تقييمات العملاء
لا توجد تقييمات لهذا المنتج حتى الآن. هل جرَّبته بالفعل؟ كن أول من يخبر الآخرين!

الأسئلة الشائعة

EMA
Supertrend
يتم توفير المنتجات المتاحة من خلال cTrader Store، بما في ذلك روبوتات التداول والمؤشرات والإضافات، من قبل مطوري الطرف الثالث وإتاحتها لأغراض الوصول المعلوماتي والفني فقط. cTrader Store ليس وسيطًا ولا يقدم نصائح استثمارية أو توصيات شخصية أو أي ضمان للأداء المستقبلي.

المزيد من هذا المؤلف

مؤشر
AI
ATR
+27
SR Commander is a clean and intelligent support and resistance indicator for cTrader, built to help traders identify key
مؤشر
AI
ATR
+20
Buy and Sell Signals
مؤشر
AI
ATR
+27
WICK COMMANDER — Know Exactly When the Market Commits
مؤشر
AI
ATR
+27
Overbought Oversold Indicator
مؤشر
AI
ATR
+20
Know Sure Thing (KST) momentum engine
مؤشر
AI
SMC
+5
Coloring trendline/ Colored Trendline / Color Trendline
مؤشر
AI
ATR
+27
VWAP Sniper Elite -- Institutional Trend Engine
مؤشر
AI
SMC
+13
Dynamic Liquidity Depth exposes hidden volume
مؤشر
AI
ATR
+26
Entry Momentum MACD Power Guide
مؤشر
AI
ATR
+27
The Professional “All-in-One” Trading Suite (buy and sell indicator)
مؤشر
AI
ATR
+26
SR Commander — Multi Timeframe Edition. See where the big money draws the line. Trade on your timeframe. Think on theirs
شعار "crossover 1"
الأعلى تقييمًا
4.2
(5)
$19
/
$29
مؤشر
AI
Grid
+10
Crossover Buy and Sell Alerts and signals

قد يعجبك أيضًا

مؤشر
Pin Bar
Inside Bar
+2
Advanced candlestick pattern recognition with structural quality scoring, alerts and adaptive chart visuals.
مؤشر
Prop
Crypto
+5
VIX Pro: Confirm Real Breakouts & Filter Market Noise with Volatility
مؤشر
Prop
Forex
+5
Transform your approach to trading with our innovative Pivot Point Indicator.
مؤشر
MACD
Forex
+1
😎Read the description before purchasing💩
مؤشر
Advanced price action tool that combines multiple technical analysis concepts
مؤشر
ATR
Wedge
+2
Strong Supertrend Turn Market Movement into a Clear Map Market analysis
مؤشر
ATR
BOS
+5
Opening ranges, dynamic trend channels, and multi-scale breakout/retest analysis for clear intraday chart decisions.
شعار "Dot Momentum %BB Indicator"
الأعلى تقييمًا
4.2
(4)
$19
مؤشر
RSI
Signal
+2
Dynamic circles visualize price's volatility position. Like RSI for market overextension & stretch. Quantify context.
شعار "KANDIKA HEAT MAP"
الأعلى تقييمًا
4.6
(5)
$19
مؤشر
Color-Based Market Pressure & Volatility Visualizer The Kandika Heatmap Indicator
مؤشر
ATR
MSS
+5
Advanced market structure and institutional cycle mapper with visual reference cards and entry alerts
مؤشر
The Multi-Timeframe Candle Indicator displays candles from multiple timeframes in one window, enhancing market analysis!
مؤشر
VWAP
Support & Resistance
Trading.FC$_vwap Algo shows VWAP trends, dynamic support/resistance and deviation bands to spot potential trade entries.
مؤشر
Customizable window inside your platform, access to any website Calendar
مؤشر
ADX
ATR
+5
Configure, simulate, and analyze trading strategies with custom filters, multi-target exits, and detailed performance me
مؤشر
Signal
This Fair Value Gap (FVG) indicator is a technical analysis on multi-timeframe.
مؤشر
AI-assisted
Order Block
+5
The daily bias estimator indicator uses ICT concepts to show whether the chart is bullish or bearish on multi-time frame
مؤشر
SMC
Prop
+14
BoS ChoCH Pro,Strict Mode,False Breakout Filter,Average hit rate: 72-78%
مؤشر
Boost your trading with Candlestick Patterns for cTrader – auto-detect key signals for smarter, faster decisions!

السعر

86
المبيعات
1.18K
التثبيتات المجانية