Если вы проводили какое-то время на рынке Форекс, вы знаете, как сложно бывает определить, какая валюта действительно движет движением, особенно когда вы смотрите на несколько пар. Я часто хотел иметь более ясный способ увидеть индивидуальную производительность основных валют, а не только то, как ведет себя одна пара.
Именно поэтому я разработал этот индикатор относительной силы валют.
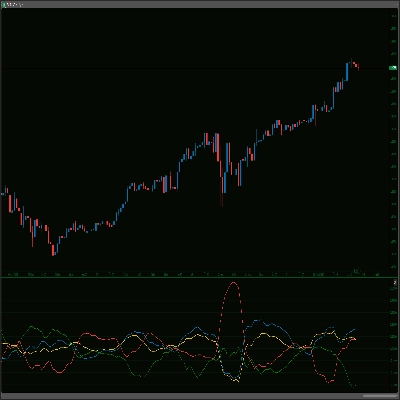
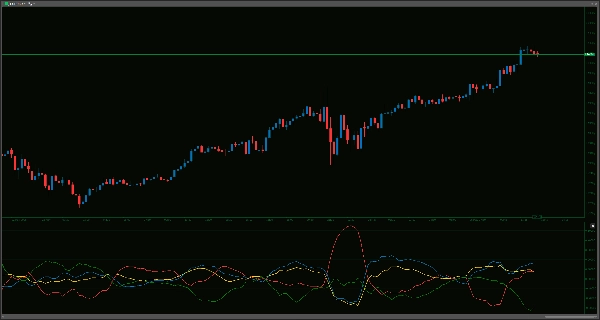
Идея довольно проста: он предназначен для измерения и отображения относительной силы AUD, USD, EUR и JPY. Он делает это, анализируя, как каждая из этих валют выступает против корзины других (конкретно по парам, таким как AUDUSD, AUDEUR, AUDJPY, EURUSD, EURJPY и USDJPY) за период, который вы можете задать.
Как я нашел его полезным и как он может помочь вам:
- Лучший выбор пар: Иногда, видя, что, например, AUD постоянно укрепляется, а JPY ослабевает, это может подтолкнуть вас к более внимательному рассмотрению AUD/JPY. Это помогает сузить круг пар, на которых вы сосредотачиваетесь.
- Понимание движущих сил рынка: Когда пара, например, EUR/USD движется, это в основном сила USD или слабость EUR? Этот индикатор может дать вам представление об этом, помогая понять общий поток.
- Настройка под ваш стиль:
-
- Вы можете настроить
LookbackPeriod(по умолчанию 14 баров). Более короткий период будет более отзывчивым, более длинный покажет более устоявшиеся тренды. - Также есть
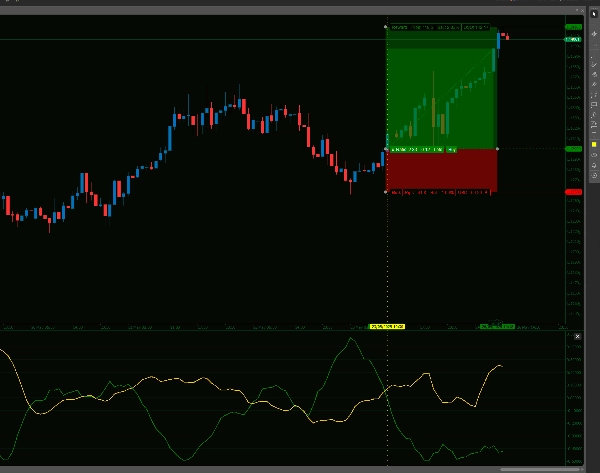
SmoothingPeriod(по умолчанию 5 баров), который применяет EMA к линиям силы. Это может помочь уменьшить некоторый шум, если вы предпочитаете более плавный результат. Если вы хотите получить необработанный расчет, просто установите сглаживание в 0.
- Вы можете настроить
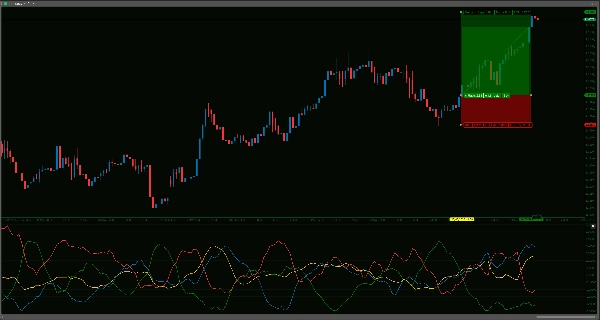
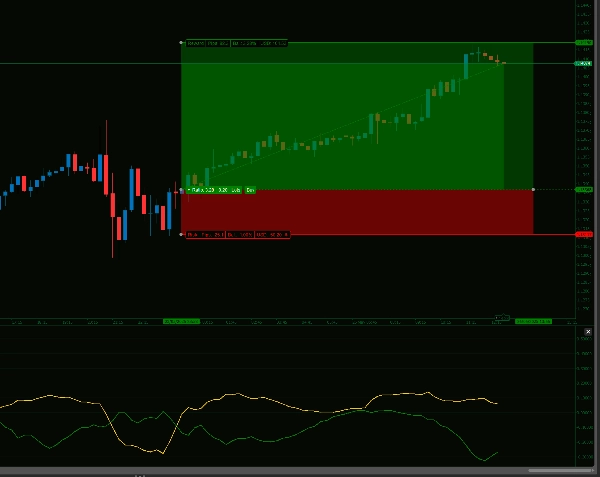
- Четкая визуализация: Он отображает силу каждой валюты отдельной линией в отдельном окне под вашим основным графиком, так что не загромождает ваше ценовое действие.
- Надежные данные: Расчеты выполняются по закрытию каждого бара, поэтому линии не будут перерисовываться или изменяться после завершения бара.
Ни один индикатор не является хрустальным шаром, и этот не исключение. Это инструмент. Я нашел его полезной частью моего аналитического процесса, особенно для подтверждения идей или быстрого обзора того, что происходит с основными валютами.
Обратите внимание, что поскольку этот индикатор собирает данные по всем валютным парам для эффективного расчета истинной относительной силы, он может быть ресурсоемким и иногда вызывать сбои Ctrader, если у вас есть другие ресурсоемкие индикаторы. У меня это случилось один раз за последний месяц на моем 5-летнем ПК, так что это не должно происходить регулярно. Но если это случится, простое обновление временного интервала окна или небольшая корректировка настроек периода на +/-1 заставит индикатор пересчитать данные и снова появиться.
--------------------------
Пожалуйста, не стесняйтесь ознакомиться с моими другими индикаторами!
https://ctrader.com/products/1181
https://ctrader.com/products/1182
https://ctrader.com/products/1180
https://ctrader.com/products/1015
https://ctrader.com/products/555
https://ctrader.com/products/553
https://ctrader.com/products/554
https://ctrader.com/products/552
https://ctrader.com/products/557
https://ctrader.com/products/845
https://ctrader.com/products/848
https://ctrader.com/products/847
https://ctrader.com/products/846
https://ctrader.com/products/551
https://ctrader.com/products/574
https://ctrader.com/products/573
https://ctrader.com/products/556
https://ctrader.com/products/558
5 | 67 % | |
4 | 33 % | |
3 | 0 % | |
2 | 0 % | |
1 | 0 % |


![Логотип продукта "[Stellar Strategies] MARSI Signal Plotter"](https://cdn.ctrader.com/image/webp/7b2b8da6-8f8e-4646-8d4a-4710c516c01e_25567)
![Логотип продукта "[Stellar Strategies] Inside Bar with Signals"](https://cdn.ctrader.com/image/webp/1d9e8bfa-3b2c-4440-bb37-5856902008a7_30683)