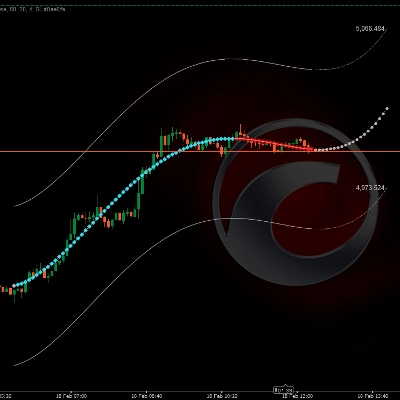
📊 Канал полиномиального прогноза цены
https://chartshots.spotware.com/c/699603101593d
🔎 ЧТО ОН ДЕЛАЕТ?
https://chartshots.spotware.com/c/69960348da652
Подбирает математическую кривую по последним N закрытиям цены и продлевает её в будущее в виде прогноза. Вокруг этой кривой строится верхний и нижний канал, ширина которого автоматически адаптируется к недавней волатильности рынка.
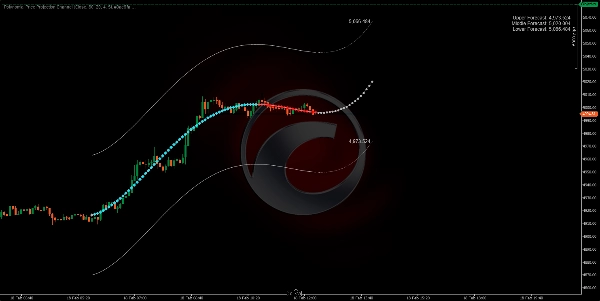
⚙️ КАК РАБОТАЕТ ЛОГИКА?
- Берёт последние N свечей (Lookback Bars) и вычисляет полиномиальную кривую, которая наилучшим образом подходит к этим ценам с помощью метода наименьших квадратов.
- Продлевает кривую вперед (Forecast Bars) как математический прогноз текущего тренда.
- Строит канал сдвигая кривую вверх и вниз, используя максимальный диапазон свечи за анализируемый период × 2.
https://chartshots.spotware.com/c/6996039a07e3a
🛠️ КЛЮЧЕВЫЕ ПАРАМЕТРЫ
Параметр
По умолчанию
Назначение
Lookback Bars
80
Сколько исторических свечей анализируется
Forecast Bars
20
Сколько свечей прогнозируется вперёд
Polynomial Order
4
Гибкость кривой (больше = больше изгибов)
Data Input
Close
Базовая цена для расчёта
🎯 КАК ИСПОЛЬЗОВАТЬ?
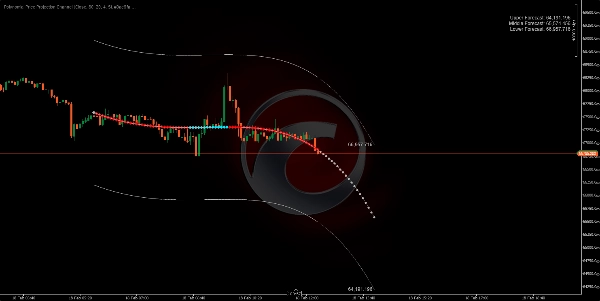
🟢 Потенциальная покупка → Цена касается нижней границы, и прогноз направлен вверх.
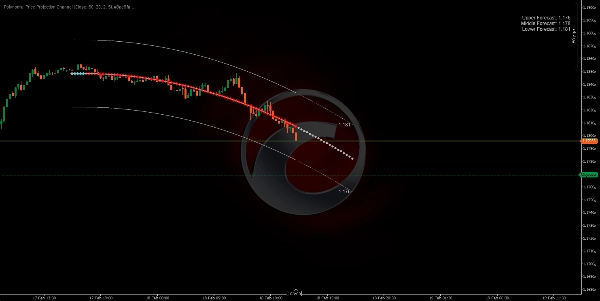
🔴 Потенциальная продажа → Цена касается верхней границы, и прогноз направлен вниз.
⚠️ Всегда подтверждайте другими факторами перед торговлей. Этот индикатор — математическая экстраполяция, а не гарантированный прогноз.
5 | 0 % | |
4 | 100 % | |
3 | 0 % | |
2 | 0 % | |
1 | 0 % |


