Opis
📊 Trading Pro Market
https://chartshots.spotware.com/c/69f0ec41d4cfc
Kanał trendu + prognoza ceny + automatyczne strefy wsparcia i oporu — wszystko w jednym wskaźniku nakładkowym
🔍 Co to jest?
https://chartshots.spotware.com/c/69f0ec1fa9930
Trading Pro Market to zaawansowany wskaźnik analizy technicznej, który łączy trzy niezależne silniki w jedno narzędzie: kanał trendu z projekcją w przód, system prognozy ceny oparty na historycznych wzorcach ruchu oraz automatyczny detektor stref wsparcia i oporu. Wszystko jest wyświetlane bezpośrednio na wykresie cenowym — bez potrzeby osobnego panelu.
📐 Moduł 1 → Kanał ICP 🔮 Moduł 2 → Prognoza MFP 🧲 Moduł 3 → Strefy S/R
https://chartshots.spotware.com/c/69f0ec8faa957
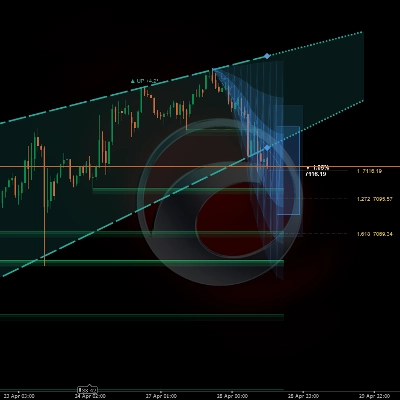
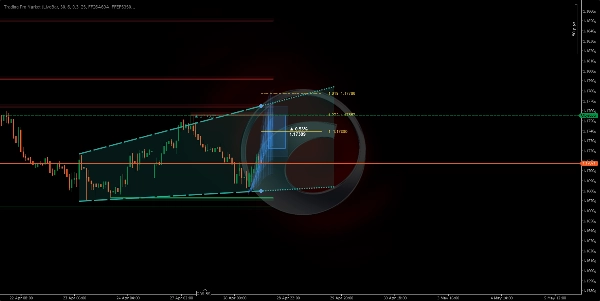
📐 Moduł 1 — Kanał trendu (ICP)
⚙️ Jak wykrywa trend?
Wskaźnik dzieli widoczne świece na bloki czasowe (domyślnie: 30 świec na blok, łącznie 6 bloków). W każdym bloku oblicza geometryczny środek pomiędzy najwyższym maksimum a najniższym minimum, używając logarytmicznej skali cen. Następnie łączy te środki pomiędzy blokami, aby określić, czy cena rośnie, spada, czy porusza się bocznie.
Nachylenie tej linii łączącej jest przeliczane na kąt wyrażony w stopniach. Jeśli kąt spada poniżej ustawionego progu (domyślnie 0,3°), rynek klasyfikowany jest jako boczny. Powyżej tego progu wskaźnik przypisuje kierunek byczy lub niedźwiedzi.
💡 Zmienność mierzona jest za pomocą estymatora Yang-Zhang — statystycznej formuły wykorzystującej ceny otwarcia, zamknięcia, maksimum i minimum do obliczenia rzeczywistej zmienności rynku. Ta wartość normalizuje kąty, dzięki czemu kanał zachowuje się spójnie dla każdego aktywa i interwału czasowego.
🎨 Co rysuje na wykresie?
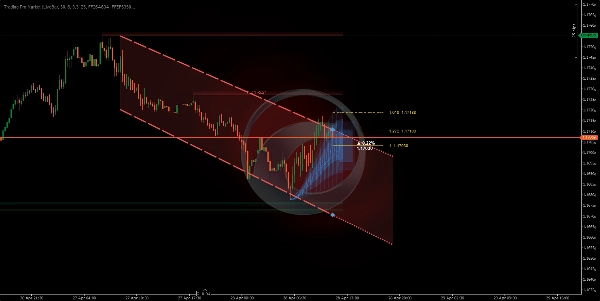
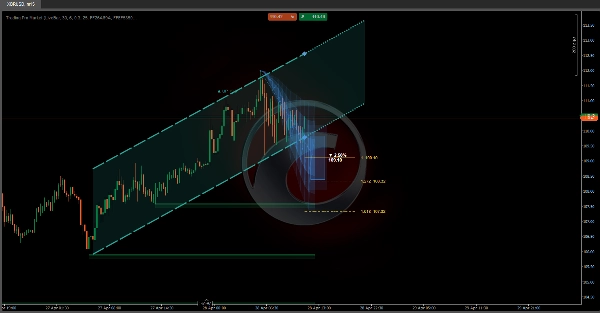
Rysuje dwie linie tworzące kanał (sufit i podłoga) z zacienioną strefą pomiędzy nimi. Po prawej kanał jest rozszerzany jako przerywana projekcja zgodna z aktualnym nachyleniem. Kolory zmieniają się automatycznie w zależności od kierunku:
🟢 Zielony — trend wzrostowy🔴 Czerwony — trend spadkowy⬜ Szary — rynek boczny
🔁 Maszyna stanów — gdzie znajduje się cena w kanale?
Wskaźnik śledzi w czasie rzeczywistym pozycję ceny zamknięcia względem granic kanału i klasyfikuje sytuację na pięć odrębnych stanów:
🟦 Wewnątrz→⚡ Wybicie→📏 Oddalony→↩️ Retest→✅ Potwierdzony
Każdy stan jest opisany prostym tekstem na panelu informacyjnym wykresu, wraz z procentową odległością od sufitu lub podłogi kanału w danym momencie.
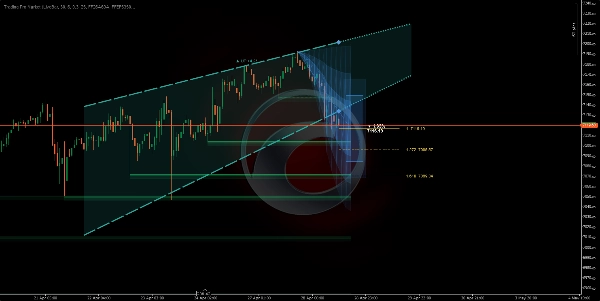
🔮 Moduł 2 — Prognoza ruchu (MFP)
⚙️ Jak generuje prognozę?
Silnik wykrywa istotne punkty zwrotne ceny (lokalne maksima i minima) analizując określoną liczbę świec wstecz. Każdy potwierdzony punkt zwrotny zapisuje dwa dane: procentowy zakres ruchu oraz liczbę świec, które ten ruch zajął. Przechowywanych jest do 20 historycznych ruchów, a oczekiwany następny ruch jest obliczany za pomocą jednej z trzech metod:
⚖️ Ważona — ostatnie ruchy mają większą wagę➕ Prosta średnia — wszystkie ruchy równoważone📊 Mediana — odrzucanie wartości odstających
🎨 Co rysuje na wykresie?
Trzy opcjonalne elementy wizualne są projektowane w przyszłość na podstawie aktualnego punktu zwrotnego:
1
🔵 Strefa projekcji: trzy warstwy o malejącej przezroczystości ilustrujące prawdopodobny zakres ruchu. Szerszy stożek oznacza większą niepewność na podstawie historycznej zmienności.
2
🎯 Pole docelowe: prostokąt umieszczony na szacowanej cenie docelowej, z oznaczeniem oczekiwanego procentowego ruchu i dokładnego poziomu cenowego w tekście.
3
📏 Poziomy Fibonacciego: linie poziome projektowane od punktu początkowego do docelowego z użyciem konfigurowalnych współczynników (domyślnie: 1.0, 1.272 i 1.618).
⚠️ Prognoza nie przewiduje przyszłości. Jest to statystyczna średnia podobnych ruchów z przeszłości. Jej wartość polega na ustalaniu realistycznych oczekiwań co do wielkości i czasu trwania — nie jako samodzielny sygnał wejścia lub wyjścia.
🧲 Moduł 3 — Strefy wsparcia i oporu
⚙️ Jak wykrywa strefy?
Za każdym razem, gdy punkt zwrotny jest potwierdzany, wskaźnik rysuje poziomą strefę, wykorzystując ATR (Average True Range) do określenia grubości strefy. Strefy oporu są rysowane na czerwono, strefy wsparcia na zielono — obie z dwoma warstwami przezroczystości, aby stworzyć głębię wizualną i czytelność.
Strefy zachowują się dynamicznie: jeśli cena zamknie się po drugiej stronie strefy, jest oznaczana jako "przebita" — zmieniając się na linię przerywaną o zmniejszonej przezroczystości. Strefy automatycznie znikają po upływie liczby świec skonfigurowanej w "Czas życia strefy".
🚀 Jak z tego korzystać
1
Potwierdź trend: sprawdź kolor i kierunek kanału. Kąt w stopniach mówi, jak silny jest trend — większy kąt oznacza większy impet.
2
Odczytaj stan ceny: panel informacyjny na wykresie opisuje, czy cena jest wewnątrz, wybija się lub testuje granicę kanału w czasie rzeczywistym.
3
Oceń projekcję: stożek i pole docelowe dają odniesienie, gdzie i jak daleko cena może się poruszyć, bazując na bibliotece historycznych wzorców zgromadzonych podczas sesji.
4
Szanuj strefy: nieprzebite pola S/R oznaczają poziomy cen, na których rynek wcześniej reagował. Strefa, która nie została przebita, ma większe znaczenie niż ta już przebita.
🖥️ Kompatybilność i wymagania
✅ cTrader✅ cAlgo API✅ Dowolne aktywo✅ Dowolny interwał czasowy✅ Nakładka cenowa
Nie jest wymagany dostęp do internetu ani specjalne uprawnienia. Wszystkie obliczenia są wykonywane lokalnie, korzystając z danych cenowych już dostępnych na platformie.
⏱️ Dla najlepszych rezultatów używaj na interwałach 15 minut lub wyższych. Na bardzo niskich interwałach (1–5 minut) szum rynkowy może generować punkty zwrotne o niskiej wiarygodności statystycznej, co obniża jakość zarówno stref S/R, jak i prognozy.
Podsumowanie
Opinie klientów
5 | 0 % | |
4 | 100 % | |
3 | 0 % | |
2 | 0 % | |
1 | 0 % |


![Logo „[Stellar Strategies] Inside Bar with Signals”](https://cdn.ctrader.com/image/webp/1d9e8bfa-3b2c-4440-bb37-5856902008a7_30683)