
Описание
Apex Break PRO рисует важные трендовые линии и оценивает каждое их пробитие.
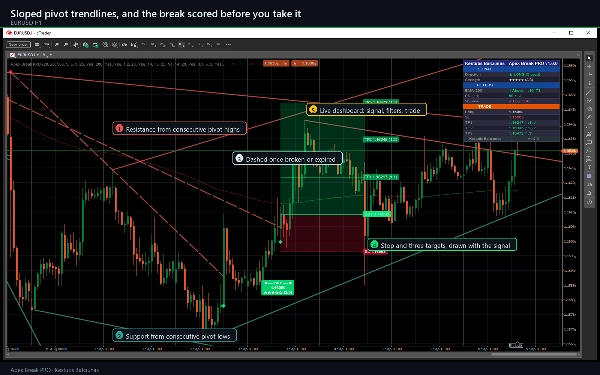
Последовательные вершины формируют наклонную линию сопротивления, последовательные минимумы — наклонную линию поддержки. Это не горизонтальные уровни: они следуют за направлением рынка и имеют срок действия. Сигнал появляется, когда закрытие ПОДТВЕРЖДЁННОГО бара пробивает одну из этих линий с запасом, измеряемым в ATR, и только если достаточно независимых фильтров согласны.
Что он рисует на вашем графике
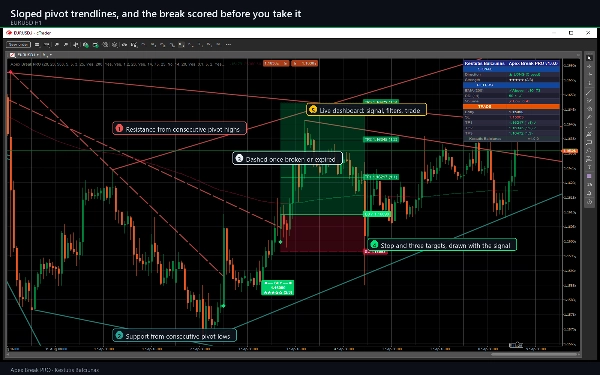
- Наклонные линии сопротивления и поддержки, до пяти каждой, сплошные пока они активны и пунктирные, когда они пробиты или исчерпали своё продолжение.
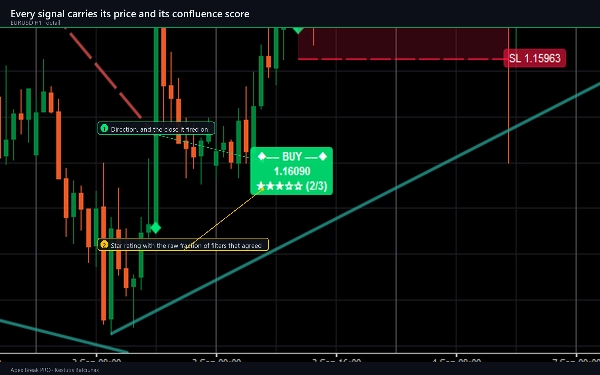
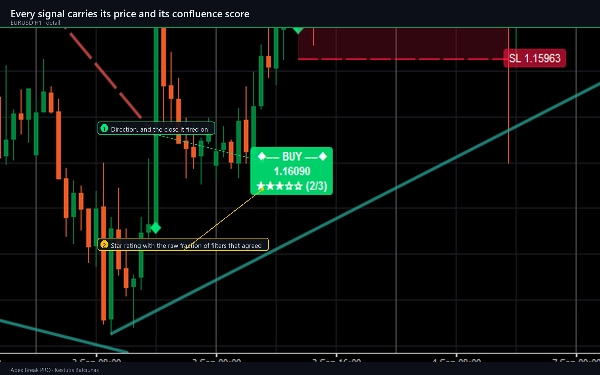
- Маркер ПОКУПКИ или ПРОДАЖИ с меткой, содержащей цену, рейтинг из пяти звёзд и долю совпадений, например 3/4.
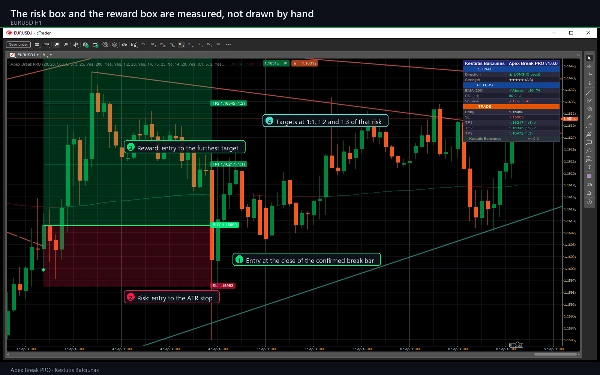
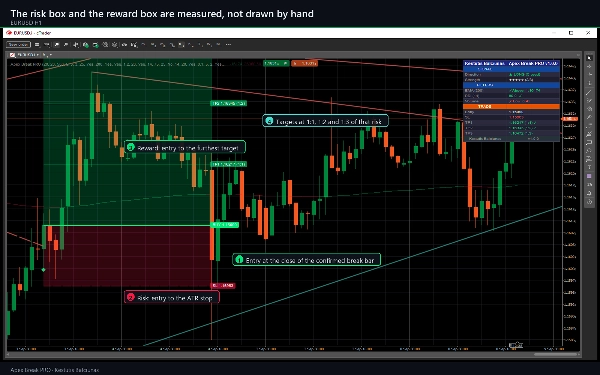
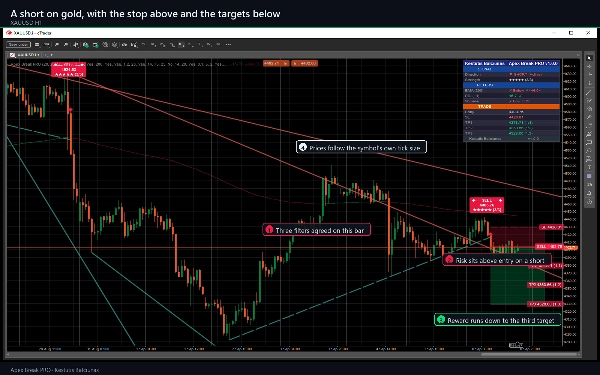
- Стоп по умолчанию на уровне 1,5 x ATR и три цели на уровнях 1:1, 1:2 и 1:3 от этого расстояния, с затемнённой зоной риска и затемнённой зоной прибыли.
- 200 EMA, окрашенная в зависимости от того, с какой стороны от неё торгуется цена.
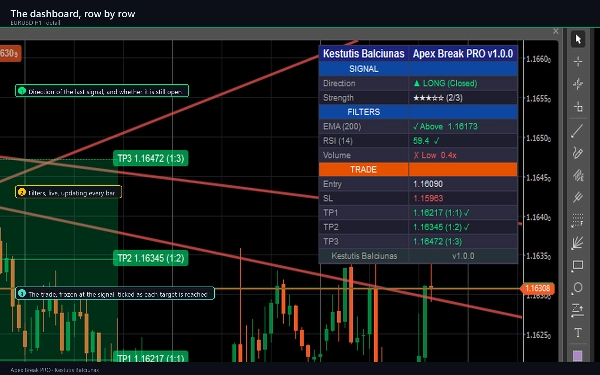
- Двухколоночная панель с разделом СИГНАЛ, разделом активных ФИЛЬТРОВ и разделом СДЕЛКА, который отмечает каждую цель по мере её достижения.
Как торговать с ним
- Дайте ему историю. При стандартных настройках требуется около 250 баров до появления первой линии, потому что 200 EMA должна сформироваться, а подтверждение пивота происходит только через 20 баров после его формирования.
- Ждите маркера. Пробитие оценивается на закрытом баре, поэтому маркер не меняется после его появления.
- Читайте рейтинг звёзд и строки ФИЛЬТРОВ перед тем, как действовать. Оценка показывает, сколько из включённых условий согласились на этом баре. Это описание согласия, а не вероятность.
- Используйте нарисованные стоп и цели как есть или как шаблон для собственного размера позиции.
- Следите за строками СДЕЛКИ. Каждая цель отмечается по достижении цены, а отслеживание останавливается на стопе или третьей цели.
- Включайте нужные вам оповещения. Доступно девять отдельных событий.
Ключевые настройки
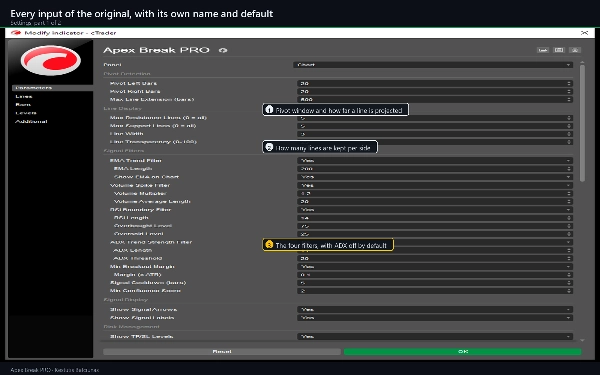
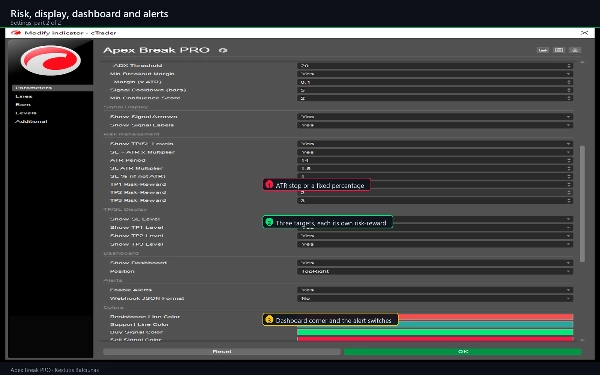
- Обнаружение пивотов: слева и справа по 20 баров, максимальное расширение линии 500 баров.
- Отображение линий: до 5 линий сопротивления и 5 линий поддержки, ширина 3, прозрачность 25.
- Фильтры сигнала: EMA 200; RSI 14 с границами 75 и 25; объём 1.2x от его 20-барного среднего; ADX 14 выше 20, по умолчанию выключен; запас пробития 0.1 x ATR; 5-барный период охлаждения; минимальный балл 2.
- Управление рисками: ATR 14, стоп на 1,5 x ATR или фиксированный процент, цели на 1:1, 1:2 и 1:3.
- Панель в шести позициях, девять переключателей оповещений и четыре цвета линий и сигналов.
Всего 65 параметров, охватывающих обнаружение пивотов, отображение линий, фильтры сигнала, управление рисками, отображение TP/SL, панель, девять переключателей оповещений с каналами доставки и цвета.
Тип индикатора, периоды, инструменты, случаи использования
Индикатор поддержки и сопротивления, тренда и волатильности, который рисует на основном графике и генерирует сигналы. Работает на любом символе и любом таймфрейме. M15, H1 и H4 — это окна, для которых он был разработан; более низкие периоды дают больше сигналов с более узкими стопами по ATR, D1 и выше — меньше сигналов, но шире. Фильтр объёма используется там, где брокер предоставляет объём, и может быть отключён там, где нет. Типичные применения: входы по пробою трендовой линии с указанным совпадением, установка стопа на основе ATR, поэтапный выход на 1:1, 1:2 и 1:3, подтверждение на старших таймфреймах и подача сигнала в cBot через скрытый выход.
Для кого он предназначен
Трейдеры, которые уже рисуют трендовые линии вручную и хотят, чтобы они рисовались одинаково на каждом графике, каждый раз, с оценкой пробоя до того, как они на него отреагируют. Это инструмент анализа: он никогда не размещает, не изменяет и не закрывает ордера и не имеет доступа к вашему счёту.
Пробная версия: что добавляет полная версия
Пробная версия — это та же сборка, ограниченная EURUSD, без ограничения по времени и с доступом ко всем параметрам. На любом другом символе вместо рисования показывается уведомление. Полная версия снимает блокировку символов: все валютные пары, индексы, металлы, энергоносители и криптовалюты, которые предлагает ваш брокер.
Технические заметки и ограничения
- Сигналы оцениваются на закрытых барах и не перерисовываются. Пивот подтверждается только после формирования Pivot Right Bars, и эта задержка подтверждения — цена за отсутствие перерисовки. Сами трендовые линии являются предварительными на формирующемся баре.
- Оповещения срабатывают только на барах, закрывающихся после подключения индикатора, никогда на истории.
- Отметки на строках целей фиксируют, что цена позже коснулась нарисованного уровня на истории вашего графика. Это не результаты сделок: не учитываются спред, комиссия, своп, проскальзывание или исполнение, и из них не выводится статистика.
- График сохраняет самые последние метки сигналов и трендовые линии и удаляет самые старые.
- Два брокера не имеют идентичные свечи, поэтому сигналы на живом графике будут отличаться от тех же индикаторов на другом фиде. Это разница в данных, а не в расчётах.
- Требования: cTrader 5.0 или новее, тестировалось на 5.9. Права доступа: отсутствуют — нет доступа к файлам, сети или торговле.
Поддержка
Вопросы через вкладку Обсуждение на этой странице или через Связь с продавцом. Обновления бесплатны и перечислены в истории версий. В магазине действует 14-дневный период возврата денег. Если индикатор вам подходит, рейтинг поможет другим трейдерам его найти.
Торговля связана с риском. Прошлые результаты не гарантируют будущих.
Сводка
Key features include visual BUY/SELL markers with price labels, star ratings indicating filter confluence, ATR-based stops (default 1.5x ATR), and three profit targets at 1:1, 1:2, and 1:3 risk-reward ratios. It also displays a 200 EMA colored by price position, shaded risk and reward zones, and a two-column dashboard showing live signals, filters, and trade progress.
Signals are generated on confirmed closed bars without repainting, and alerts can be configured for nine different events. The indicator supports volume filtering where available and includes 65 customizable parameters covering pivot detection, line display, filters, risk management, and alerts. Apex Break PRO is intended for traders who manually draw trendlines and seek consistent, scored breakout signals for analysis and trade planning. It does not execute trades or access accounts.