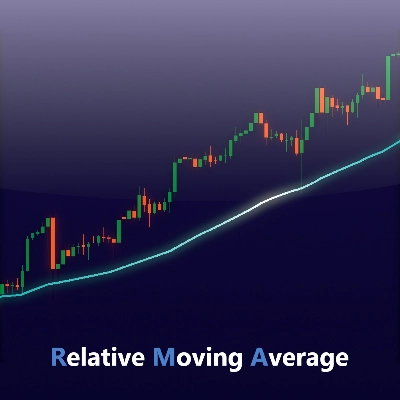
Memperkenalkan Penunjuk Purata Pergerakan Relatif (RMA), kini tersedia untuk cTrader!
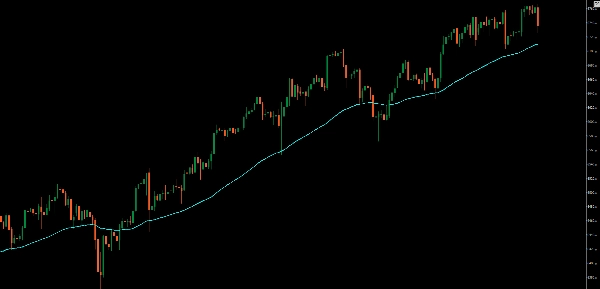
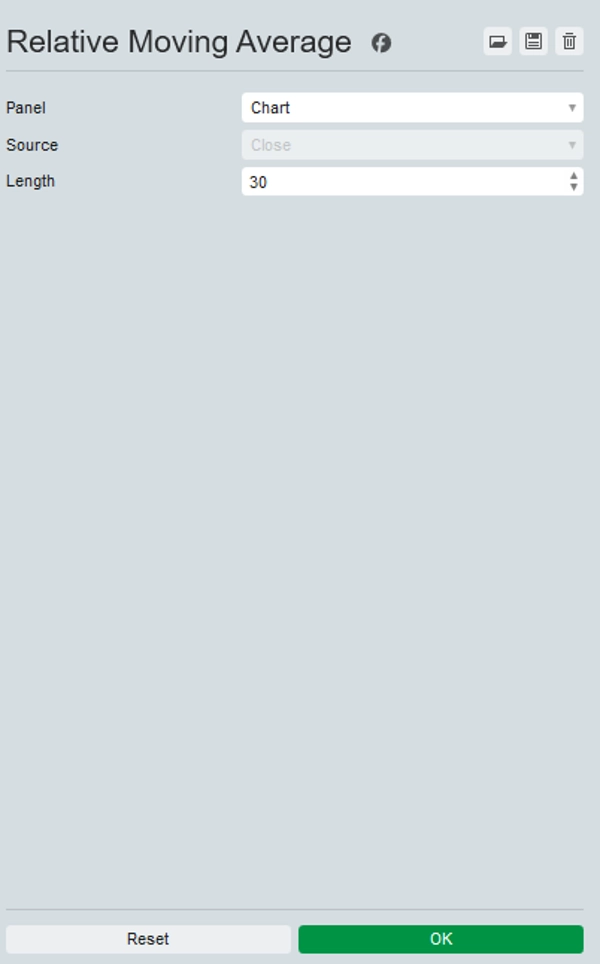
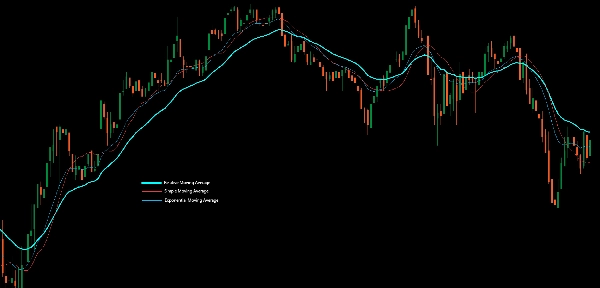
The Purata Pergerakan Relatif (RMA) — juga dikenali sebagai Purata Pergerakan Licin (SMMA) — adalah sejenis purata pergerakan yang bertujuan mengurangkan kelewatan sambil mengekalkan kelicinan pada lengkung. Ia menggunakan formula yang sama seperti fungsi “RMA” terbina dalam TradingView, yang banyak digunakan dalam penunjuk popular seperti Indeks Kekuatan Relatif (RSI).
RMA direka untuk mengimbangi antara kepekaan dan kestabilan. Ia dikemas kini dengan lebih licin berbanding Purata Pergerakan Eksponen (EMA) tetapi bertindak balas lebih cepat terhadap perubahan harga berbanding Purata Pergerakan Mudah (SMA).
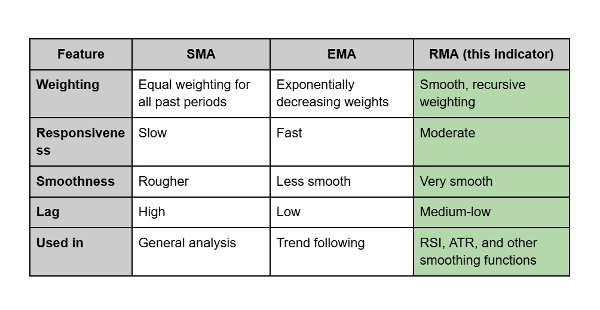
Perbezaannya:
- The SMA mengira purata semua harga secara sama rata, menyebabkan kelewatan dan ketidakstabilan.
- The EMA memberi lebih berat kepada harga terkini, menjadikannya sangat responsif tetapi kadang-kadang bising.
- The RMA, sebaliknya, menggabungkan kelebihan kedua-duanya: ia melicinkan turun naik sambil mengekalkan tindak balas tepat pada masanya terhadap perubahan harga.
Penggunaan Praktikal:
Pedagang sering menggunakan RMA sebagai garis tren yang lebih licin atau sebagai sebahagian daripada penunjuk momentum. Ia sangat berkesan apabila anda ingin menapis bunyi tanpa memperkenalkan kelewatan yang ketara — sesuai untuk mengesahkan tren jangka panjang atau menyokong analisis terlebih beli/terlebih jual.


![Logo "High-Low Divergence [Iridio Capital]"](https://cdn.ctrader.com/image/webp/443c4661-7abb-40f1-842f-4b6ec560649b_40914)
